
- Title
-
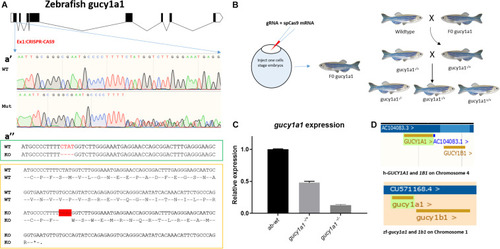
sGC Activity and Regulation of Blood Flow in a Zebrafish Model System
- Authors
- Vishnolia, K.K., Rakovic, A., Hoene, C., Tarhbalouti, K., Aherrahrou, Z., Erdmann, J.
- Source
- Full text @ Front. Physiol.
|
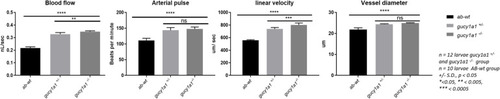
Blood flow parameters measured from AB-wild types, heterozygote and homozygote for PHENOTYPE:
|
|
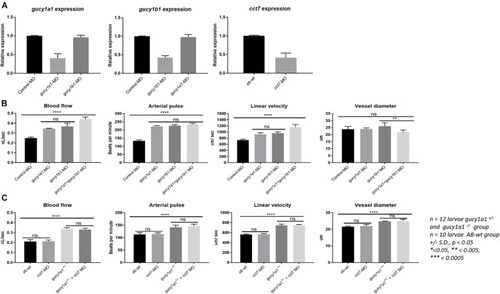
PHENOTYPE:
|