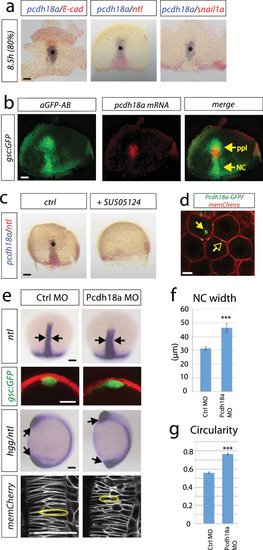
A cell group in the axial mesoderm regulates notochord morphogenesis in zebrafish. a Characterization of the prechordal plate (ppl) by whole-mount double in situ hybridization (ISH) of wild-type (WT) zebrafish embryos with the indicated markers. Scale bar: 100 µm. b Mapping of pcdh18a mRNA expression (red) relative to Tg(gsc:GFP) expression labelled by anti-GFP antibody (green). Notably, gsc:GFP labels the prechordal plate (ppl) and the trailing notochord (NC). Scale bar: 100 µm. c Inhibition of nodal signalling by SB505124 treatment (30 µM) from 4 to 8.5 h post-fertilization (hpf). Scale bar: 100 µm. d Confocal image of live zebrafish embryo at 5 hpf showing subcellular localization of Pcdh18a-GFP. Glycosylphosphatidylinositol-anchored mCherry (memCherry) marks cell membranes. Arrows indicate punctae of Pcdh18a localization at the membrane (open arrows) and intracellularly (closed arrows). Scale bar: 10 µm. e WT embryos or Tg(gsc:GFP) embryos were injected with Pcdh18a MO (0.5 mM). Morpholino-based knockdown of Pcdh18a leads to a wider and shorter notochord marked by ntl expression at 9 hpf (arrows). See Supplementary Fig. S1h for control experiments. Analysis of the shape of the notochord in a cross section of gsc:GFP transgenic embryos that were injected with the indicated constructs at 10 hpf. At 11 hpf, the body length was significantly shorter in the Pcdh18a-deficient embryos, as shown in an ISH-based analysis of notochord hgg/ntl (n = 20/32, arrows). Confocal microscopy-based analysis of cell shapes in the notochord of embryos that were microinjected with the indicated constructs at 12 hpf (cells with exemplary morphology were surrounded with a yellow circle). Scale bar: 100 µm. fpcdh18a MO-injected embryos show a wider axial mesoderm compared to Ctrl MO injected embryos (four embryos each). g Circularity of NC cells was measured in total of 1000 cells in five different embryos each. A circle has a circularity of 1.0, while noncircular shapes have a lower value of circularity. The error bars represent the SEM and significance as indicated (***p value < 0.001; unpaired Student’s t test)
|
