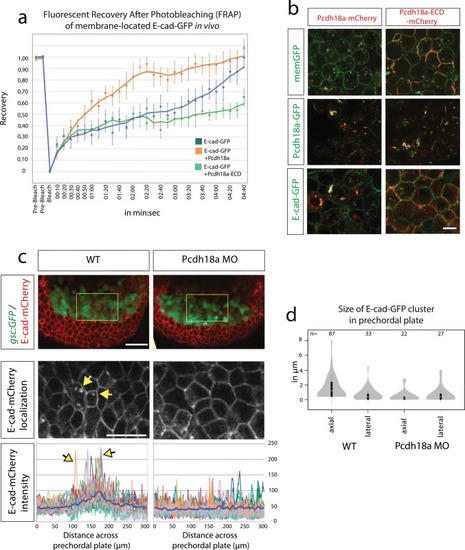
Pcdh18a domains and their importance with regard to endocytosis. a After photobleaching of a 3 µm spot at the cell membrane of E-cadherin-expressing embryos, new E-cadherin-GFP molecules moved into the bleached area from adjacent membrane regions, resulting in a return of 90% of fluorescence within 4 min 20 s (blue). Co-expression of Pcdh18a increased the speed of recovery and a 90% recovery was reached after 2 min 20 s (orange). Co-expression of Pcdh18a-ECD diminished FRAP of E-cadherin-GFP (green). Moving-average trendline was calculated with period 3. b Confocal images of zebrafish embryos at 5 hpf (50% epiboly). Embryos were injected with 0.1 ng mRNA of indicated constructs. In the deletion construct Pcdh18a-ECD, the intracellular domain was replaced by a mCherry domain. Pcdh18a-mCherry was localized to vesicles, whereas Pcdh18a-ECD-mCherrry was strongly localized to the cell membranes. Pcdh18a-GFP/Pcdh18a-mCherry and Pcdh18a-GFP/Pcdh18a-ECD-mCherry showed co-localization at the membrane and in vesicles suggesting homophilic interaction. Pcdh18a-mCherry/E-cadherin-GFP suggest heterophilic interaction. Pcdh18a-ECD-mCherry and E-cadherin-GFP were observed mainly at the membrane and did not co-localize suggesting that the intracellular domain of Pcdh18a is required for interaction and co-internalization with E-cad. Scale bar: 10 µm. cTg(gsc:GFP) embryos were injected with 0.1 ng of the e-cadherin-mCherry mRNA or co-injected with the pcdh18a MO (0.5 mM) and subjected to confocal microscopy analysis at 8 hpf. A cross section at the level of the ppl reveals enhanced E-cad localization at the plasma membrane and in endocytic vesicles, as shown by a projection of five fluorescence intensity histograms of five different embryos. Scale bar: 100 µm and 50 µm, respectively. d Bean plots shows the distribution, means, and standard deviations of the sizes of e-cadherin-GFP clusters in the lateral and axial mesodermal plate measured in 20 WT and pcdh18a morphant embryos
|
