
Fig. 8
- ID
- ZDB-FIG-200723-53
- Publication
- Xu et al., 2020 - Unifying Developmental Programs for Embryonic and Post-Embryonic Neurogenesis in the Zebrafish Retina
- Other Figures
- All Figure Page
- Back to All Figure Page
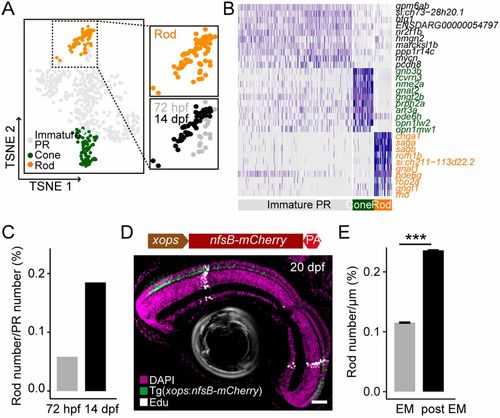
Distinct fate outputs of embryonic RPCs and postembryonic RSCs. (A) Cell clusters of PR subtypes that were obtained from the pool of single cells of 72-hpf retinas and GFP-positive cells of 14-dpf retinas of Tg(PCNA:GFP). Cells are colored by their cluster assignments. Rod cluster is enlarged on the right, and it is shown by stages of 72 hpf (gray) and 14 dpf (black). (B) Heat-map of gene expression showing the top 10 differentially expressed genes for each distinct cell cluster of PRs. Specific marker genes of cone and rod are depicted by green and orange, respectively. (C) Bar plot showing the ratios of rods in total PRs of 72 hpf and 14 dpf. (D) Image of EdU staining of the 20-dpf retina of the Tg(xops:nfsB-mCherry) fish after a pulse of EdU at 5 dpf. A schematic of plasmid design for Tg(xops:nfsB-mCherry) is provided above the image. Scale bar: 30 μm. (E) Bar plot showing the density of rods from embryonic (EM) and postembryonic (post EM) retinogenesis. ***P<0.001 (Wilcoxon test). Data are mean±s.e.m. n=86 sections from six retinas. |