
Fig. 5
- ID
- ZDB-FIG-200723-50
- Publication
- Xu et al., 2020 - Unifying Developmental Programs for Embryonic and Post-Embryonic Neurogenesis in the Zebrafish Retina
- Other Figures
- All Figure Page
- Back to All Figure Page
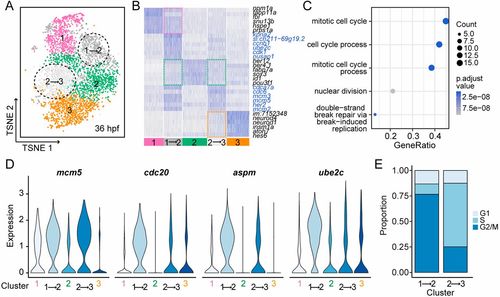
The transition between distinct states. (A) The t-SNE plot of 36-hpf RPCs. Cells are colored by their cluster assignments. Black dashed circles indicate the clusters that exhibit transitional gene expression pattern (termed as ‘transitional cluster’). (B) Heat-map for gene expression of the top six differentially expressed genes for each cluster in 36-hpf RPCs. Clusters 1- to 3-specific marker genes are depicted by pink, green and orange dashed squares, respectively. The genes highly expressed in transitional clusters are highlighted with blue. (C) Biological process enrichment analysis for genes highlighted by blue in B. The x-axis corresponds to the gene ratio quantifying the fraction of genes belonging to a particular biological process. The color code and size correspond to the corrected P-value and number of genes involved in the biological process, respectively. (D) Violin plots showing the expression levels of known S/G2/M markers in distinct and transitional clusters. (E) The proportions of cells within different cell cycle phases in transitional clusters. |