
Fig. 3
- ID
- ZDB-FIG-200723-48
- Publication
- Xu et al., 2020 - Unifying Developmental Programs for Embryonic and Post-Embryonic Neurogenesis in the Zebrafish Retina
- Other Figures
- All Figure Page
- Back to All Figure Page
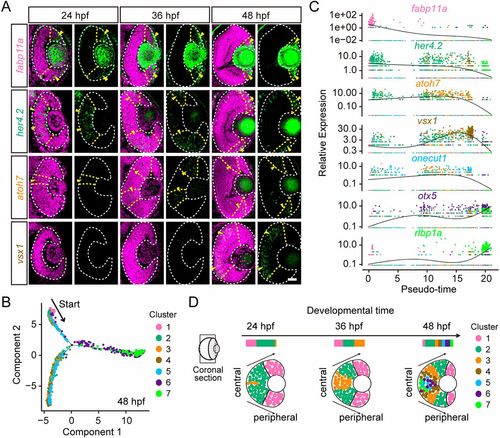
Temporal emergence of distinct cell clusters. (A) In situ hybridization images of cluster-specific marker genes (Clusters 1 to 4). Genes are colored by their corresponding clusters. The retina boundaries are indicated by the white dashed lines. Yellow arrowheads indicate the areas showing in situ signals (green). The nuclei are labeled by DAPI (magenta). Scale bar: 30 μm. (B) The pseudo-time trajectories of distinct clusters of 48-hpf RPCs. Cells are colored by their cluster assignments. (C) The expressions of cluster-specific marker genes across pseudo-time. Genes are colored by their cluster assignments. (D) Schematic summary of the evolution of different distinct clusters in a representative coronal retina section. The spatial distribution of individual cluster-specific marker genes suggests the emergence order of distinct developmental states from Clusters 1 to 7. |