
Fig. 4
- ID
- ZDB-FIG-200723-49
- Publication
- Xu et al., 2020 - Unifying Developmental Programs for Embryonic and Post-Embryonic Neurogenesis in the Zebrafish Retina
- Other Figures
- All Figure Page
- Back to All Figure Page
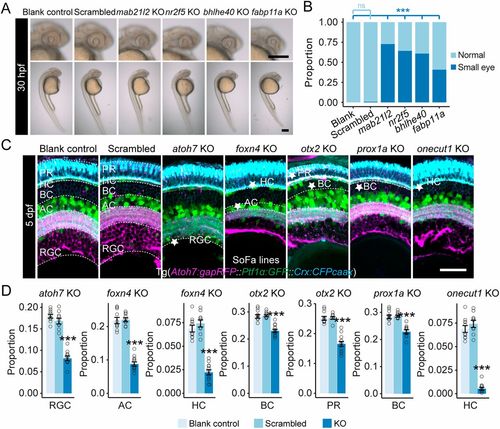
Individual developmental states represent various aspects of retinal development. (A) Representative images showing small eyes at 30 hpf as the result of disruption of Cluster 1-specific marker genes (mab21l2, nr2f5, bhlhe40 and fabp11a). Scale bars: 120 μm. (B) Plot showing the proportions of small eyes at 30 hpf as the result of disruption of individual Cluster 1-specific marker genes. ***P<0.001 (Fisher's exact test compared with the blank control). ns, no significant difference. (C) Confocal images of the retinas (coronal view) of SoFa fish lines at 5 dpf after disruption of Cluster 3- (atoh7, foxn4), Cluster 4- (otx2, prox1a) and Cluster 5- (onecut1) specific marker genes. The cell types that decreased significantly in cell number are labeled with stars. Scale bar: 30 μm. (D) Quantitative plots showing the proportions of cell types that decreased significantly in cell number from corresponding gene disruption groups in C (data are mean±s.e.m., data points are shown). ***P<0.001 (Wilcoxon test compared with the control groups). KO, knockout. |