
Fig. 4
- ID
- ZDB-FIG-181130-16
- Publication
- Petratou et al., 2018 - A systems biology approach uncovers the core gene regulatory network governing iridophore fate choice from the neural crest
- Other Figures
- All Figure Page
- Back to All Figure Page
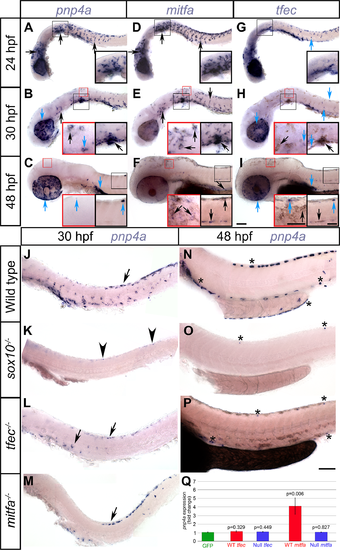
pnp4a is activated by mitfa in premigratory and migrating NC, and by cooperative action of sox10 and tfec in iridoblasts. At 24 hpf and at 30 hpf, chromogenic WISH reveals strong similarities between the pattern of pnp4a and mitfa in migrating NC in the trunk and in cells posterior to the otic vesicle (A, B, D, E, black arrows), but which is distinct from tfec, which is present in more restricted groups of cells (G, H, blue arrows). At this stage, melanising cells in the head and anterior trunk show distinct expression of both mitfa and pnp4a (B,E, insets, black arrows). At 48 hpf, mitfa is expressed in melanised cells (F, black arrows), but pnp4a is not detectable in these melanocytes (C). From 30 hpf, some aspects of pnp4a expression are similar to those of tfec (B, H, blue arrows) and at 48 hpf both genes are expressed in ib(df) locations (C, I, blue arrows). (J-Q) Mutant analysis. At 30 hpf, mitfa (M) and tfec (L) mutants retain only a subset of the WT pnp4a expression; remaining cells in the former display a ib(df) pattern and in the latter a melanoblast pattern (M, L, arrows). tfec mutants lack pnp4a expression at 48 hpf, with the exception of rare escaper cells in iridophore positions (P, asterisks). Note that embryo in N, but not in O or P, was treated with PTU to inhibit melanisation; dark pigment in P is melanin. In sox10 mutants, pnp4a is largely absent, although weak expression persists in a few premigratory NCCs (K, arrowheads) at 30 hpf, and in rare escaper cells in iridophore positions at 48 hpf (O, asterisks). (Q) qRT-PCR measurement of pnp4a expression after expression of Mitfa or Tfec in early zebrafish embryos. Overexpression of WT Mitfa results in ectopic activation of pnp4a in injected embryos at 6 hours post-injection, whereas mutant Mitfa (null) does not. Interestingly, neither WT nor mutant Tfec is sufficient to drive pnp4a expression at this stage. Fold activation is calculated following normalisation to pnp4a levels upon overexpression of GFP. Graph is representative of 2 biological replicates, each with 3 technical replicates. Error bars indicate respective standard error of the mean. p-values indicate the significance of mean fold change for each sample when compared to the mean of GFP, using a two-tailed, unpaired t-test. Lateral views, head towards the left. Scale bars: 100 μm. Inset scale bars: 50 μm. |
| Genes: | |
|---|---|
| Fish: | |
| Anatomical Terms: | |
| Stage Range: | Prim-5 to Long-pec |
| Fish: | |
|---|---|
| Observed In: | |
| Stage Range: | Prim-15 to Long-pec |