
Fig. S5
- ID
- ZDB-FIG-181130-19
- Publication
- Petratou et al., 2018 - A systems biology approach uncovers the core gene regulatory network governing iridophore fate choice from the neural crest
- Other Figures
- All Figure Page
- Back to All Figure Page
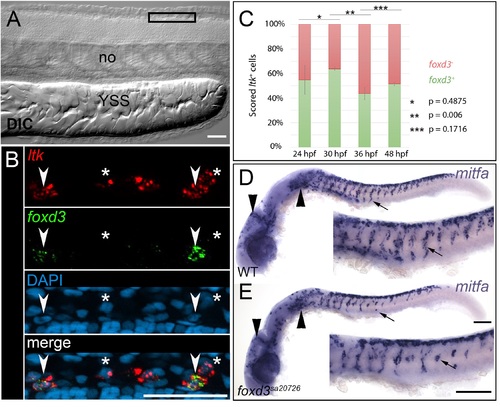
foxd3 is not a good candidate for the role of factor R in the iridophore lineage. (A, B) RNAscope experiments at 36 hpf reveal that foxd3 does not fulfil the criteria established using our models for factor R, as it is only expressed in a subset of ltk+ ib(df) of the posterior dorsal trunk. In (B) arrowheads point at ltk+ cells that co-express foxd3, while asterisks indicate cells that are only positive for ltk. (C) RNAscope experiments at 24 hpf, 30 hpf, 36 hpf and 48 hpf indicate that 55%, 64%, 44% and 52%, respectively, of ltk+ cells co-express foxd3. t-tests suggest that the proportion of cells co-expressing the two genes only significantly changed between 30 hpf and 36 hpf. (D,E) foxd3 mutants subjected to WISH at 24 hpf present with a reduction of mitfa+ cells along the migratory pathways of the posterior trunk. WT and mutant embryos show no difference in cranial NC derived mitfa+ populations (arrowheads), but noticeable and consistent decrease of migrating trunk NC derivatives (*arrows). no, notochord; YSS, yolk sac stripe. Lateral views, head towards the left. Scale bars: (A,B) 50 μm, (D,E) 100 μm. |