
Fig. S2
- ID
- ZDB-FIG-181130-18
- Publication
- Petratou et al., 2018 - A systems biology approach uncovers the core gene regulatory network governing iridophore fate choice from the neural crest
- Other Figures
- All Figure Page
- Back to All Figure Page
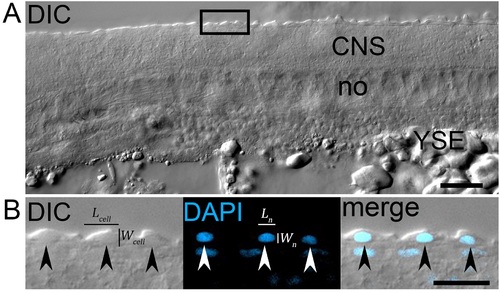
The mean cytoplasmic volume of cells in the dorsal ARPT can be calculated using high resolution DIC images combined with DAPI staining. (A) DIC image of a single focal plane from a Z-stack, showing the ARPT of a 24 hpf WT embryo. (B) Magnified view of the boxed region in (A). DIC allows for identification of the boundaries of the cells directly dorsal to the CNS (likely epidermal), while DAPI stain renders the nuclei visible. It is thus possible to measure the length (L) and width (W) of whole cells (arrowheads), as well as of their respective nuclei. CNS, central nervous system; no, notochord; YSE, yolk sac extension. Lateral view, head positioned towards the left. Scale bar: A: 50 μm; B: 20 μm. |