
Fig. S2
- ID
- ZDB-FIG-180206-2
- Publication
- Singh et al., 2017 - Different developmental histories of beta-cells generate functional and proliferative heterogeneity during islet growth
- Other Figures
- All Figure Page
- Back to All Figure Page
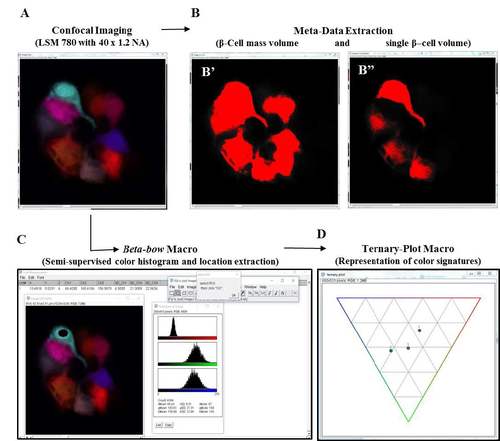
Setup for image analysis and data processing using the Beta-bow system. (A-D) Schematic of data extraction and analysis using the Beta-bow system. (A) Beta-bow samples were imaged using a Zeiss LSM 780 confocal microscope with a 40 x 1.2 NA water-objective. The confocal images were analyzed using ImageJ macros developed in-house. (B) The meta-data for volumetric measurements were obtained by thresholding the images. (B') Cells containing red, blue and green colors were used for extracting the volume of the total beta-cell mass in the primary islet. (B'') The color channels were separated in ImageJ, and the green or blue colors were used for measuring the single-cell volume of beta-cells. (C) For determining the color signatures of beta-cells, the nuclei of the multicolor beta-cells were manually outlined and the information was transferred to a macro for extracting and saving the regional color histogram. Only those cells that exhibit trichromatic color signatures were used for clonal analysis. (D) Visual representations of color signatures were made possible by plotting normalized values on a ternary plot. |