
Fig. S1
- ID
- ZDB-FIG-180206-1
- Publication
- Singh et al., 2017 - Different developmental histories of beta-cells generate functional and proliferative heterogeneity during islet growth
- Other Figures
- All Figure Page
- Back to All Figure Page
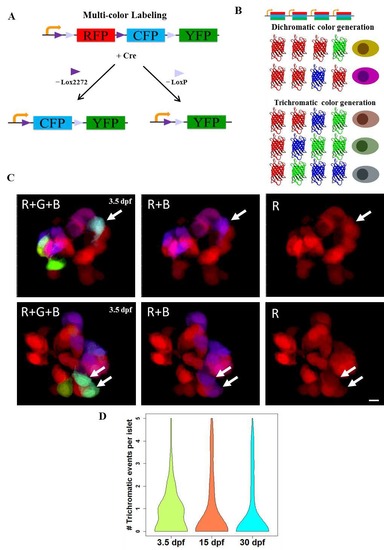
The Beta-bow system for unique labeling of individual beta-cells. (A-B) Schematic of multicolor labeling using beta-bow. (A) Induction of Cre recombinase (driven by the insulin (ins) promoter and activated by 4-OHT treatment) excises the DNA flanked by either Lox2272 (►) or LoxP (►), thereby switching RFP expression to CFP or YFP, respectively within the beta-cells. (B) Presence of several floxed cassettes in each cell leads to multiple discrete recombination events, which result in the combinatorial expression of fluorescent proteins and unique labeling of beta-cells in different colors. The expression of either green or blue fluorescence together with the red color in beta-cells can arise after a single-recombination event. In contrast, the induction of trichromatic cells, which express the green, blue and red colors together, requires at least two independent recombination events in the same cell. (C) Confocal projections of beta-bow islets showing trichromatic events, either single beta-cells (top panels) or pairs of cells, which consist of two cells with the same color combination (bottom panels). Beta-bow recombination was induced using a treatment with 4-OHT at 24 hours post-fertilization (hpf). The samples were analyzed at 3.5 days post-fertilization (dpf). In 105 recombined islets, there were 85 trichromatic events, of which eighty were singlets and five were pairs of cells, each of the pairs consisting of two cells with the same color combination. (D) Violin plots showing the probability density (distribution) of the numbers of trichromatic events (single cells or multicellular clones) per recombined islet at 3.5, 15 and 30 dpf (n>50 islets per stage from three independent experiments). Recombination was induced by treatment with 4-OHT from 24 to 30 hpf. The mean frequency of trichromatic events does not appear to change significantly between time points. The mean values for trichromatic events per islet were 0.8 (3.5 dpf), 0.87 (15 dpf) and 0.77 (30 dpf). Scale bars, 5 μm. |