
Fig. 8
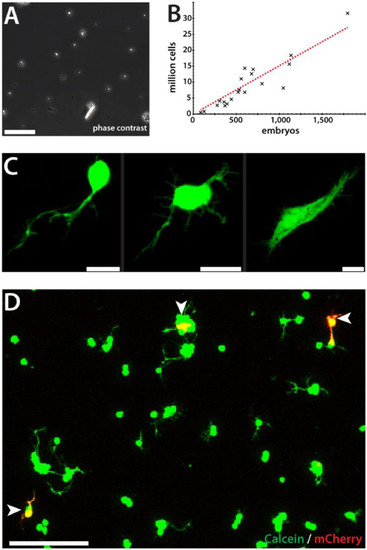
Transfection of zebrafish primary cells by electroporation. (A) Dissociated primary cells. Scale bar, 50 µm. (B) Linear relation between the number of embryos and resulting calculated total cell number. On average, dissociation of 89.3 i.e. 90 embryos will result in 1 million primary cells. n = 20. (C) Electroporation of a pCS-eGFP into wild type primary cells results in fluorescence in apparently differentiated cells in culture (1 dap). Scale bars, 10 µm. (D) Wild type primary cells were electroporated with pCS-mCherry, plated and stained with Calcein-AM at 1 dap to calculate the amount of live transfected cells (white arrowheads). Scale bar, 50 µm. |
Reprinted from Developmental Biology, 430(1), Sassen, W.A., Lehne, F., Russo, G., Wargenau, S., Dübel, S., Köster, R.W., Embryonic zebrafish primary cell culture for transfection and live cellular and subcellular imaging, 18-31, Copyright (2017) with permission from Elsevier. Full text @ Dev. Biol.