
FIGURE
Fig. S3
Fig. S3
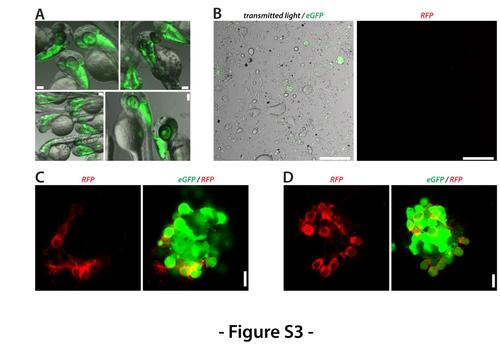
Activation of molecular marker expression after plating. (A) Double transgenic Tg(ptf1a:eGFP) / Tg(ca8:FyntagRFP)bz4Tg embryos show only GFP expression at 2 dpf. Scale bar, 100 μm. (B) No RFP expression could be detected in a primary cell culture obtained from double transgenic Tg(ptf1a:eGFP) / Tg(ca8:FyntagRFP)bz4Tg embryos 60 min after plating. Scale bar, 100 μm. (C) and (D) At 1 dap, few cells were observed in which the expression of the transgene ca8:FyntagRFP was activated. Scale bar, 10 μm. Shown is a collection of the images of two preparations with comparable results. |
Expression Data
Expression Detail
Antibody Labeling
Phenotype Data
Phenotype Detail
Acknowledgments
This image is the copyrighted work of the attributed author or publisher, and
ZFIN has permission only to display this image to its users.
Additional permissions should be obtained from the applicable author or publisher of the image.
Reprinted from Developmental Biology, 430(1), Sassen, W.A., Lehne, F., Russo, G., Wargenau, S., Dübel, S., Köster, R.W., Embryonic zebrafish primary cell culture for transfection and live cellular and subcellular imaging, 18-31, Copyright (2017) with permission from Elsevier. Full text @ Dev. Biol.