
Fig. 4
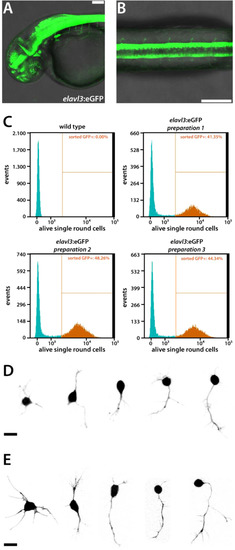
Flow cytometry-sorted neurons show normal morphologies in culture. (A) Tg(elavl3:eGFP)knu3 embryo (lateral view, 2 dpf). Scale bar, 50 µm. (B) Spinal cord of a Tg(elavl3:eGFP)knu3 embryo (dorsal view, 2 dpf). Scale bar, 50 µm. Anterior is always to the left. (C) Dissociated primary cells of 2 dpf wild type (n = 1 preparation) and elavl3:eGFP embryos (n = 3 preparations) gated by the settings described in Fig. S2 were further gated and sorted regarding GFP-expression and plotted as histogram. Virtually no GFP-positive (GFP+) cells were detected in the wild type preparation, meaning that all GFP+ cells of the elavl3:eGFP preparations indeed expressed the transgene. The amount of GFP+ cells was comparable in all three elavl3:eGFP preparations. (D)elavl3:eGFP-positive cells prepared with the standard protocol for primary cell culture (1 dap). Scale bar, 10 µm. (E) Same morphologies as observable in (D) can be found among elavl3:eGFP-positive cells which have been selected by flow cytometry and cultured for 1 day. Scale bar, 10 µm. Shown are collections of the images of (D) two and (E) three preparations with comparable results. |
Reprinted from Developmental Biology, 430(1), Sassen, W.A., Lehne, F., Russo, G., Wargenau, S., Dübel, S., Köster, R.W., Embryonic zebrafish primary cell culture for transfection and live cellular and subcellular imaging, 18-31, Copyright (2017) with permission from Elsevier. Full text @ Dev. Biol.