
Fig. 5
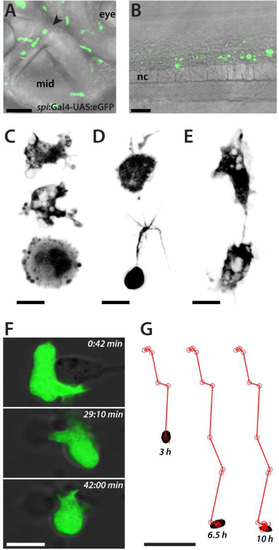
Macrophages in culture. (A) Lateral detail of a Tg(spi1:Gal4-UAS:eGFP)zf109 embryo (2 dpf) showing the distribution and various forms of eGFP-labeled macrophages. The black arrowhead marks the midbrain-hindbrain boundary. mid, midbrain. Scale bar, 50 µm. (B) eGFP-positive macrophages populate the trunk of a zebrafish embryo (lateral view, 2 dpf). sc, spinal cord. Scale bar, 50 µm. Anterior is always to the left. (C) Representative amoeboid morphologies of eGFP-positive macrophages in culture (1 dap). Scale bar, 10 µm. (D) Macrophages with cellular extensions in culture (1 dap). Scale bar, 10 µm. (E) Two macrophages in culture making contact (1 dap). Scale bar, 10 µm. Shown is a collection of the images of two preparations with comparable results. (F) Time series of a single macrophage in culture which apparently tries to engulf cellular debris (3 dap). Scale bar, 10 µm. See also Movie 1. (G) Migration of a single macrophage in culture. Tracking was started approximately 6 h after plating. Images were recorded every 30 min for a duration of 12 h. Scale bar, 50 µm. See also Movie 2. |
Reprinted from Developmental Biology, 430(1), Sassen, W.A., Lehne, F., Russo, G., Wargenau, S., Dübel, S., Köster, R.W., Embryonic zebrafish primary cell culture for transfection and live cellular and subcellular imaging, 18-31, Copyright (2017) with permission from Elsevier. Full text @ Dev. Biol.