
Fig. S8
- ID
- ZDB-FIG-160923-13
- Publication
- Qiu et al., 2016 - Embryonic hematopoiesis in vertebrate somites gives rise to definitive hematopoietic stem cells
- Other Figures
- All Figure Page
- Back to All Figure Page
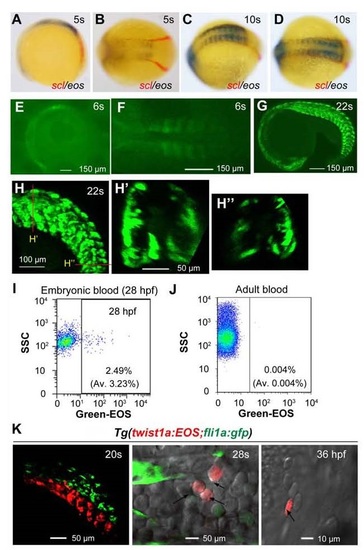
EOS expression pattern in Tg(twist1a:gfp) transgenic line. This line was identified from the founder fish that was injected with the Tol2(twist1a:EOS) construct at the one-cell stage. The expression of EOS was driven by a 4.9-kb promoter of the twist1a gene. (A-D) The expression of scl (red) and eos (black/blue) mRNAs in the transgenic embryos at indicated stages, as detected by double in situ hybridization. The embryos were orientated with anterior to the right and viewed either laterally (A) or dorsally (B-D). (E-H′′) The fluorescence of EOS protein in the transgenic embryo at indicated stages. (E and F) Weak EOS expression was observed by confocal microscopy in a transgenic embryo at 6s stage. The embryo was laterally (E) or dorsally (F) viewed with anterior to the left. (G) EOS was expressed in the migrating sclerotomal cells in a 22s embryo. (H-H′′) A trunk region of the embryo shown in (G) was enlarged (H) and two optical cross sections at indicated positions were shown in (H′ and H′′). (I) The proportion of EOS+-blood cells in the circulation of Tg(twist1a:EOS) embryonic hearts at 28 hpf was analyzed by flow cytometry. The average (Av) was the mean of three independent experiments, each including 5-10 embryos. The showed was the representative result of one experiment. (J) Green-EOS+ cells in the circulation of Tg(twist1a:EOS) transgenic adult was analyzed by flow cytometry. The showed was the representative result from a single fish with the average from three fish in parenthesis. (K) Photoconverted red-EOS+ sclerotomal cells gave rise to hematopoietic cells. The ventral region of posterior somites of Tg(twist1a:EOS;fli1a:gfp) embryos at 20s stage was photoconverted (left) and red-EOS+ (indicated by arrows) was found in the ICM at 28s stage (middle) and in the heart at 36 hpf. |
| Genes: | |
|---|---|
| Fish: | |
| Anatomical Terms: | |
| Stage Range: | 5-9 somites to Adult |