
Fig. 3
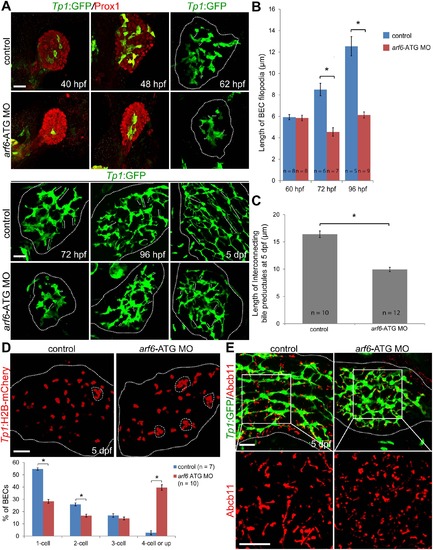
arf6 regulates intrahepatic biliary morphogenesis. (A-C) Confocal images showing the development of the intrahepatic biliary network. Tg(Tp1:GFP) embryos/larvae were processed for immunostaining with anti-GFP (green). For 40 and 48 hpf, anti-Prox1 staining (red) was also used. Brackets delineate the length of BEC filopodia at 62, 72, and 96 hpf, and the length of interconnecting bile preductules at 5 dpf (A); graphs show their quantitation (B, C). (D) Confocal images showing the location of BEC nuclei in the entire liver. The Tg(Tp1:H2B-mCherry) line reveals BEC nuclei. Dashed lines outline clusters with four or more BECs. Graph shows the percentage of BECs present as single cells, doublets, triplets, or in clusters of four or more cells. (E) Confocal images of the liver immunostained for GFP (green) and Abcb11 (red). The Tg(Tp1:GFP) line and anti-Abcb11 reveal the intrahepatic biliary structure and bile canaliculi, respectively. All dotted lines outline the liver. Asterisks, statistical significance (* p<0.0001); error bars, ± SEM; scale bars, 25 µm. |
| Genes: | |
|---|---|
| Antibodies: | |
| Fish: | |
| Knockdown Reagent: | |
| Anatomical Terms: | |
| Stage Range: | Prim-25 to Day 5 |
| Fish: | |
|---|---|
| Knockdown Reagent: | |
| Observed In: | |
| Stage Range: | Pec-fin to Day 5 |