
Fig. S7
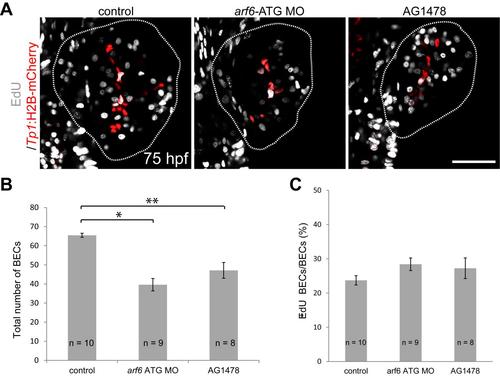
Proliferation is not affected in arf6-ATG MO-injected or AG1478-treated larvae at 75 hpf. (A) Confocal images showing EdU+ proliferating cells (gray) and H2B-mCherry+ BECs (red) in the liver of control, arf6-ATG MO-injected, or AG1478-treated Tg(Tp1:H2B-mCherry) larvae. For EdU labeling, the larvae were treated with EdU for one hour prior to harvest. Dotted lines outline the liver. Scale bar, 50 µm. (B) Graph showing the total number of BECs in each liver. Asterisks indicate statistical significance: * p<0.0001, ** p<0.005. (C) Graph showing the percentage of EdU+ BECs among BECs. Error bars, ± SEM. n indicates the number of larvae examined. |
| Fish: | |
|---|---|
| Condition: | |
| Knockdown Reagent: | |
| Observed In: | |
| Stage: | Protruding-mouth |