
Fig. 4
- ID
- ZDB-FIG-150608-4
- Publication
- Hermkens et al., 2015 - Sox7 controls arterial specification in conjunction with hey2 and efnb2 function
- Other Figures
- All Figure Page
- Back to All Figure Page
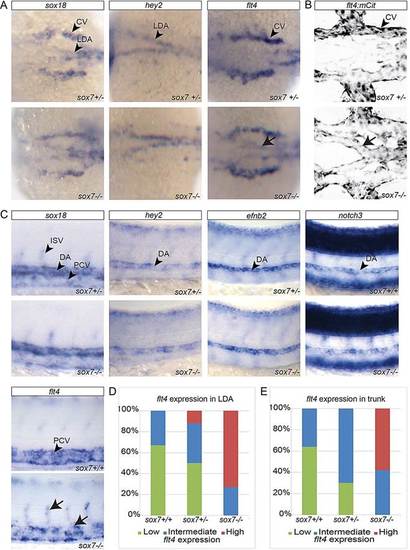
flt4 expression is altered in arterial cells of sox7 mutants. (A-C) sox7hu5626 siblings (upper panel) and mutants (lower panel). (A) In situ hybridization for sox18, hey2 and flt4 in sox7hu5626 heterozygous and mutant embryos at 20hpf (dorsal view). sox7hu5626 mutants display elevated flt4 expression levels in the LDA (arrow). (B) Dorsal view of flt4:mCitrine (flt4:mCit)-positive sox7hu5626 heterozygous and homozygous mutant at 26hpf showing elevated mCitrine expression in the LDA of sox7hu5626 mutant (arrow) compared with sox7hu5626 siblings. (C) Lateral view of the trunk region of sox7hu5626 siblings and mutants with in situ hybridization for sox18, hey2, efnb2, notch3 and flt4 at 24-27hpf. sox7hu5626 mutants display higher flt4 expression in DA and ISVs (arrows) compared with siblings. (D) Quantification of 20-24hpf embryos based on their flt4 expression levels (in situ hybridization) in the LDA. Seventy-three percent of sox7hu5626 mutants have high expression of flt4 in LDA region at 20hpf (total of 30 embryos). (E) Quantification of 24-27hpf embryos based on their flt4 expression levels (in situ hybridization) in the trunk. Fifty-eight percent of sox7hu5626 mutants have elevated flt4 expression, which was never observed in siblings (total of 57 embryos). (L)DA, (lateral) dorsal aorta; (P)CV, (posterior) cardinal vein; ISV, intersegmental vessel. |
| Genes: | |
|---|---|
| Fish: | |
| Anatomical Terms: | |
| Stage Range: | 20-25 somites to Prim-5 |