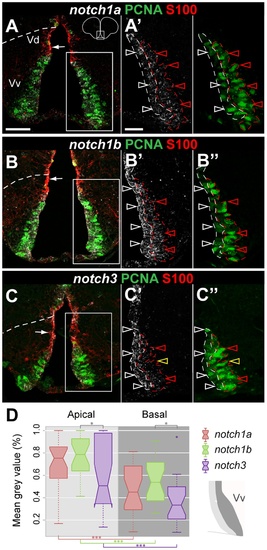
Notch receptor expression in the ventral telencephalic proliferation zone.
Confocal images showing the localization of Notch receptors by FISH (white) in PCNA+ proliferating cells (green) and in the S100β glial cells of Vd (red). A–A , notch1a, B–B, notch1b and C–C , notch3 expression in the ventral telencephalon. All three receptors are express in S100β cells of Vd (white arrows). A ′ -A ′′, B ′ -B ′′ and C ′ -C ′′show the individual channels for Notch receptor expression and PCNA at a higher magnification of the respective boxed areas. Notch receptor + /PCNA + cells with apical nucleus (unfilled white arrowheads) display a stronger expression intensity than PCNA cells with basal nucleus (unfilled red arrowheads); unfilled yellow arrowhead indicate Notch receptor - /PCNA + cells. Scale bars = 50 μm in A′ (applies to B and C) and 25 in A ′ (applies to B ′, C ′ and A ′′ -C ′′). D, The notched boxplot represents the relative mean grey values of notch expression in proliferating cells with apical or basal nucleus, as illustrated in the schematics and by the respective dashed lines indicated in the higher magnification pictures shown above; the middle line of the box represents the median; the bottom and top of the box represents the 25 and 75 percentiles, respectively; whiskers indicate the minimum and maximum; circle indicates an outlier; total n = 13. Significance levels: p<0.001(***),p<0.05(*) .
|
