
Fig. 3
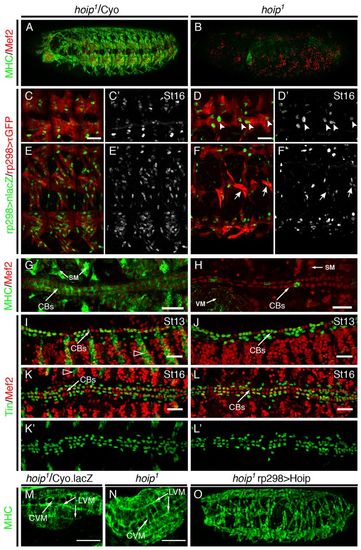
Hoip regulates somatic muscle and cardioblast maturation but not precursor specification. (A,B) Mef2 and MHC protein expression in St16 embryos. Lateral views. Robust MHC and Mef2 expression is detectable in somatic muscles of hoip1/Cyo.lacZ embryos (A). Mef2 expression is unaffected in hoip1 embryos, whereas MHC is nearly absent from the somatic muscle (B). (C-F) St16 rp298.gal4>τ.GFP, rp298.nlacZ embryos double-labeled for GFP (red) and lacZ (green). (C-D2) Dorsal muscles. The number of lacZ+ nuclei is reduced in hoip1 embryos (C) compared with hoip1/Cyo.lacZ embryos (D); however, binucleated dorsal muscles show complete elongation (arrowheads). (E-F2) Lateral and ventral muscles. The number of lacZ+ nuclei is also reduced in lateral and ventral muscles in hoip1 embryos. Multinucleate lateral muscles show incomplete elongation (arrows). (G,H) Mef2 and MHC protein expression in St16 embryos. Dorsal views. (G) hoip1/Cyo.lacZ embryos express Mef2 and MHC in mature CBs. (H) hoip1 embryos express Mef2 but not MHC in a great majority of CBs. (I-L2) Mef2 and Tin protein expression. (I,J) hoip1/Cyo.lacZ embryos express Mef2 in all myogenic precursors, including CBs. Tin is expressed in four Mef2+ CBs per hemisegment at St13 (I; lateral view) and St16 (K; dorsal view). Mef2 and Tin expression in hoip1 CBs is comparable with control embryos at St13 (J) and St16 (L). (K2,L2) Tin expression alone. (M,N) High magnification micrographs of visceral muscles in St16 embryos. MHC expression is comparable between hoip1/Cyo.lacZ embryos (M) and hoip1 embryos (N). Both genotypes develop LVMs and CVMs in the visceral mesoderm. (O) hoip1 rp298>Hoip embryos express MHC protein at near wild-type levels in the somatic mesoderm. SM, somatic muscle; VM, visceral muscle; LVM, longitudinal visceral muscle; CVM, circular visceral muscle; CBs, cardioblasts. Open arrowheads in I,K show ectodermal cytoplasmic lacZ expression that distinguishes hoip1 heterozygotes from homozygotes. Scale bars: 20 μm. |