
Fig. S7
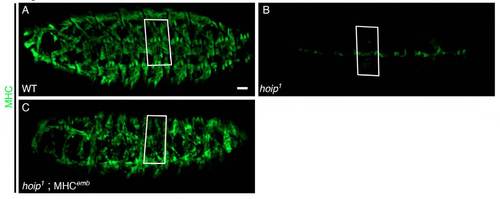
Method to quantify MHC expression by mean fluorescence intensity. (A-C) Z-stacks including only the somatic muscles from St16 embryos stained for MHC. MHC expression was clearly restored in hoip1 embryos by MHCemb; however, muscle morphology was not (compare A with C). To quantify MHC expression in the somatic musculature (SM), we used the Zeiss LSM Zen 2011 software to trace the medial region of a segment using SBMs to define anterior-posterior position of each segment (white boxes). The software then calculated mean fluorescent intensity (MFI) within each boxed region. We also measured fluorescent intensity in the visceral musculature (VM). To normalize MHC expression, we divided SM MFI by VM MFI to obtain relative fluorescence for each segment. |