
Fig. 5
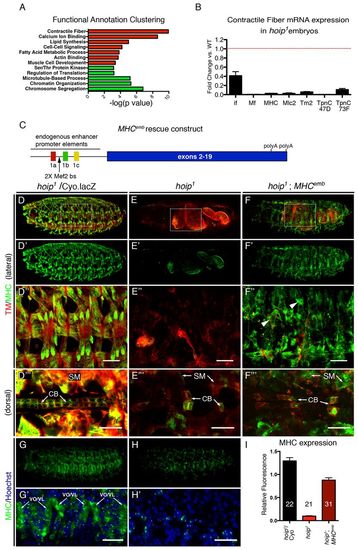
Hoip processes transcripts encoding sarcomere components. (A) Functional Gene Ontology (GO) analysis of misregulated transcripts in hoip1 embryos. Clusters of down- and upregulated transcripts are shown in red and green, respectively. The most significant cluster is associated with the term Contractile Fiber. (B) qPCR of Contractile Fiber transcript expression in hoip1 embryos compared with wild type. (C) The MHCemb transgene. The construct contains endogenous, somatic muscle MHC enhancer elements, multiple transcriptional start sites (colored 1st exons), an embryonic MHC cDNA and the endogenous poly A sites. bs, binding site. (D-F22) St16 embryos double-labeled for Tropomyosin (Tm) and MHC. Compared with hoip1/Cyo.lacZ embryos (D), both MHC and Tm are largely undetectable in the somatic and cardiac musculature of hoip1 embryos (E). In hoip1; MHCemb embryos, MHC protein expression is restored to near wild-type levels in somatic but not cardiac muscles; Tm remains largely undetectable in hoip1; MHCemb embryos (F). MHCemb does not rescue somatic muscle morphology defects (arrowheads) or MHC expression in cardioblasts (CBs). The Tm antibody recognizes both Tm1 and Tm2: RNA-seq showed a 0.50 (Tm1) and 0.09 (Tm2) fold change in hoip1 embryos compared with wild type (Table 2). (G,H) St16 embryos co-labeled for MHC mRNA and Hoechst. (G,G2) MHC mRNA shows both nuclear and cytoplasmic localization in the somatic muscle fibers of control embryos. (H,H2) MHC mRNA is exclusively detected in somatic muscle nuclei of hoip1 embryos. High magnification views in G2 and H2 show three segments of ventral oblique (VO) and ventral lateral (VL) muscles. (I) Quantification of MHC expression in the somatic musculature. Mean fluorescent intensity was calculated for lateral muscles over an entire segment (see supplementary material Fig. S7). The number of segments assayed is given for each genotype. Error bars represent s.e.m. Scale bars: 20 μm. |