
FIGURE
Fig. S16
- ID
- ZDB-FIG-101129-31
- Publication
- Baskin et al., 2010 - Visualizing enveloping layer glycans during zebrafish early embryogenesis
- Other Figures
- All Figure Page
- Back to All Figure Page
Fig. S16
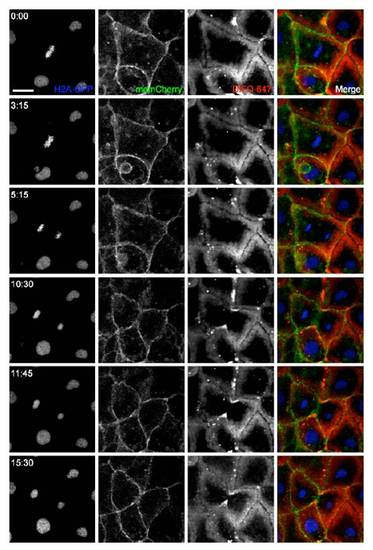
Time-lapse monitoring of membrane and glycan movement during mitosis. H2A-GFP transgenic zebrafish were microinjected into the blastomere cell at the one-cell stage with GalNAz and mRNA for memCherry. Embryos were allowed to develop to 10 hpf, at which point they were reacted with DIFO-647 (100 μM, 1 h) and imaged by confocal microscopy. Blue, H2A-GFP; green, memCherry; red, DIFO-647. A single z-plane fluorescence image is shown at each time indicated (min:s). Scale bar: 20 μm. |
Expression Data
Expression Detail
Antibody Labeling
Phenotype Data
Phenotype Detail
Acknowledgments
This image is the copyrighted work of the attributed author or publisher, and
ZFIN has permission only to display this image to its users.
Additional permissions should be obtained from the applicable author or publisher of the image.
Full text @ Proc. Natl. Acad. Sci. USA