
FIGURE
Fig. 2
- ID
- ZDB-FIG-101129-13
- Publication
- Baskin et al., 2010 - Visualizing enveloping layer glycans during zebrafish early embryogenesis
- Other Figures
- All Figure Page
- Back to All Figure Page
Fig. 2
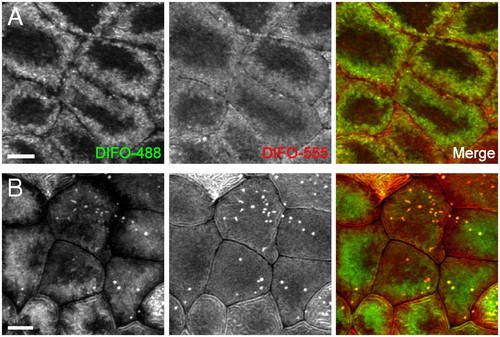
Two-color, time-resolved labeling enables visualization of O-glycan trafficking. Zebrafish embryos were microinjected with GalNAz, allowed to develop to 9 hpf, and reacted with DIFO-488 (100 μM, 1 h). The embryos were then allowed to further develop for 2 h (A) or 12 h (B), at which point they were reacted with DIFO-555 (100 μM, 1 h) and then imaged by confocal microscopy. Shown are maximum intensity z-projection images of superficial enveloping layer cells. Green, DIFO-488; red, DIFO-555. (Scale bar: 10 μm.) |
Expression Data
Expression Detail
Antibody Labeling
Phenotype Data
Phenotype Detail
Acknowledgments
This image is the copyrighted work of the attributed author or publisher, and
ZFIN has permission only to display this image to its users.
Additional permissions should be obtained from the applicable author or publisher of the image.
Full text @ Proc. Natl. Acad. Sci. USA