
Fig. S11
- ID
- ZDB-FIG-101129-26
- Publication
- Baskin et al., 2010 - Visualizing enveloping layer glycans during zebrafish early embryogenesis
- Other Figures
- All Figure Page
- Back to All Figure Page
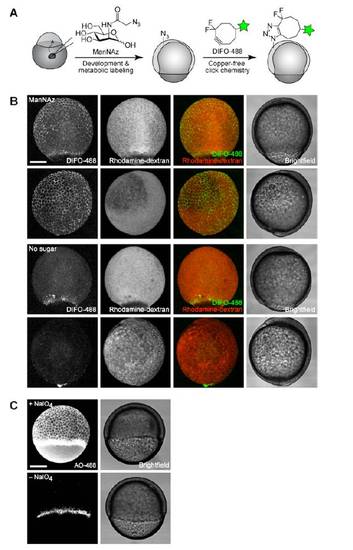
Imaging of sialylated glycans via either microinjection of ManNAz or treatment with sodium periodate. (A) Schematic depicting metabolic approach for imaging of sialylated glycans. (B) Zebrafish embryos were microinjected with 25 pmol of ManNAz or no sugar, allowed to develop to 8 hpf, reacted with DIFO-488 (100 μM, 1 h), and imaged by confocal microscopy. Shown are maximum intensity z-projection fluorescence images and corresponding brightfield images. Green, DIFO-488; red, rhodamine-dextran. (C) Zebrafish embryos (6 hpf) were bathed in NaIO4 (500 μM, 30 min, top row) or no reagent (bottom row), reacted with AO-488 (100 μM, 1 h, pH 6.7), and imaged by confocal microscopy. Shown are maximum intensity z-projection images of AO-488 fluorescence and corresponding brightfield images. Scale bars: 200 μm. |