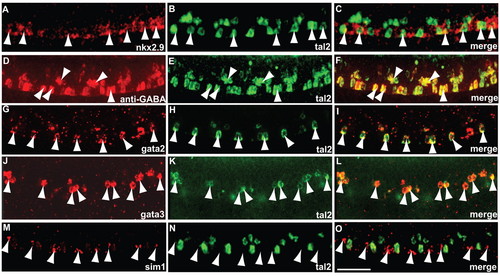
Mapping co-expression of marker genes and GABA in the zebrafish lateral floor plate. (A-C) nkx2.9 (A) and tal2 (B) mRNA expression and a merged view (C). nkx2.9-positive cells (arrowheads) co-express tal2. (D-F) GABA immunohistochemistry (D), tal2 in situ hybridization (E) and a merged view (F). tal2-expressing cells (arrowheads) are GABAergic. (G-I) gata2 (G) and tal2 (H) mRNA expression and a merged view (I). gata2 and tal2 mRNAs (arrowheads) are co-expressed in the lateral floor plate. More dorsally in the spinal cord, not all gata2-positive cells are tal2-positive. (J-L) gata3 (J) and tal2 (K) mRNA expression and merge (L). gata3 mRNA-expressing cells co-express tal2 mRNA in the lateral floor plate. However, more dorsally, only a proportion of gata3-positive cells also expresses tal2 mRNA. The tal2-negative, gata2- and gata3-positive cells are probably V2b/VeLD interneurons (Batista et al., 2008). (M-O) sim1 (M) and tal2 (N) mRNA expression and merge (O). sim1-expressing interneurons and tal2-expressing cells in the lateral floor plate are distinct in most cases. Only in 25% of cells did we find co-expression of the two markers. (A-F) Projections of several sections. (G-O) Single confocal planes. Embryos were 24 (A-L) or 36 (M-O) hpf. Dorsal up, anterior left. Scale bar: 50 μm.
|
