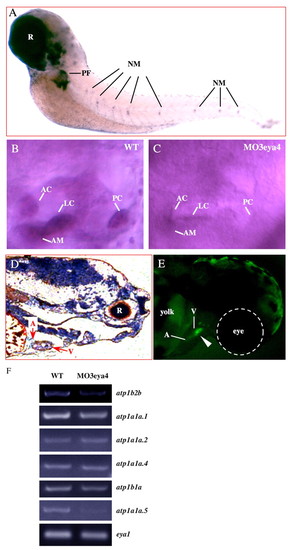
atp1b2b expression in zebrafish embryos (72 hpf). (A) Whole-mount in situ hybridization with DIG-labeled atp1b2b antisense probe revealed expression in the otic vesicle, neuromast (NM), retina (R) and pectoral fin (PF). (B) Higher resolution image of atp1b2b expression in a lateral view of the otic vesicle with robust signals in the anterior macula (AM), and the anterior, lateral and posterior cristae (AC, LC and PC, respectively) in wild type. (C) In the eya4 morphant otic vesicle, atp1b2b expression was notably reduced in the AC, LC, PC and AM. (D) In situ hybridization of sections using a radiolabeled atp1b2b antisense probe show atp1b2b expression in the heart. Expression in the ventricle (V) is greater than in the atrium (A). DIG and radiolabeled atp1b2b sense probes produced low background signals (data not shown). (E) Fluorescent signal (arrowhead) detected at 72 hpf in zebrafish injected with plasmid pβ2bprom confirmed atp1b2b promoter activity and EGFP expression. (F) Semi-quantitative RT-PCR (see Materials and methods) showed reduced atp1b2b expression in eya4 morphant fish compared with wild type. MO3eya4 did not alter eya1 expression (Schonberger et al., 2005). Semi-quantitative RT-PCR on other Na+/K+-ATPase subunits that were expressed in the otic vesicle, including atp1a1a.1, atp1a1a.2, atp1a1a.4, atp1b1a and atp1a1a.5, are also shown.
|
