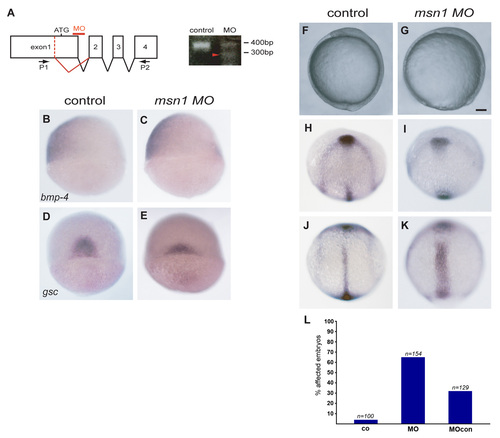
zmsn1 is required for epiboly as well as convergent extension. (A) RT-PCR analysis of msn1 mRNA of embryos injected at the one-cell stage with msn1MO-splice (MO). Primers (P1/P2) flanking the region result in a single 400 bp band in the case of control embryos. In the case of morphants, the level of this band is strongly reduced and a second band (red arrowhead) is visible. The second band results from the use of an alternative splice donor. (B-E) mRNA expression patterns of bmp-4 (B,C, dorsal is to the right) and gsc (D, E, view onto the dorsal side) to determine dorsal-ventral patterning. (F-K) Analysis of the degree of epiboly and convergent extension. Bright-field image of a control embryo at bud stage (F) and an embryo injected with msn1MO-splice at the one cell stage (G). Simultaneous analysis of the mRNA patterns of the axial markers dlx3, hgg1 and ntl in a control (H,J) and morphant (I,K) embryo. (L) Quantification of the penetrance of gastrulaltion defects in uninjected control embryos (co), embryos injected with msn1MO-splice (MO), and embryos injected with msn1MO-splice-5bp (MOcon). Shown are the percentages of embryos displaying delayed epiboly (80-95% epiboly) when uninjected embryos had reached the 100% epiboly stage Scale bar: 100 μm.
|
