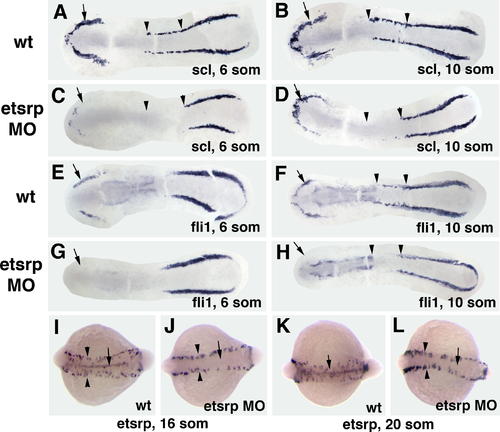
Molecular Analysis of Early Vasculogenesis in etsrp Morphants (A, B, E, F, I, K) Uninjected control embryo; (C, D, G, H, J, L) 8–10 ng etsrp MO2-injected embryo. Anterior is to the left in all panels. (A–H) Embryos were flat mounted with their yolk removed. (A–D) scl expression; six-somite (A,C) and ten-somite (B,D) stages. Note that the anterior domain of scl expression (arrows) is reduced and the trunk domain (arrowheads) is missing in etsrp morphants. (E–H) fli1 expression; six-somite (E,G) and ten-somite (F,H) stages. Note that the anterior domain of fli1 expression (arrows) is missing in the etsrp morphants, while the posterior domain is not affected. Also note that the trunk domain of fli1 expression (arrowheads, F,H) is missing at the ten-somite stage in etsrp morphants. (I–L) etsrp knockdown blocks angioblast migration towards the midline as assayed by etsrp expression at the 16-somite (I,J) and 20-somite (K,L) stages. (I,K) Uninjected control embryo; (J,L) 7.5 ng etsrp MO2-injected embryo. Dorsal view, anterior is to the left. Note that the midline stripe of angioblasts (arrows) is missing in etsrp morphants. Also notice more intense etsrp expression in pre-migratory angioblasts (arrowheads) in etsrp morphants as compared to control embryos.
|
