
- Title
-
Bi-allelic deleterious variants in SNAPIN, which encodes a retrograde dynein adaptor, cause a prenatal-onset neurodevelopmental disorder
- Authors
- Yousaf, H., de Koning, M.A., Khan, K., Gilmore, K.L., Hoffer, M.J.V., Kellaris, G., Lanone, S., Dagouassat, M., Ullah, F., Adama van Scheltema, P.N., Heron, D., Capri, Y., Kuechler, A., Schweiger, B., Haak, M.C., Keren, B., Tran Mau Them, F., Peeters-Scholte, C.M.P.C.D., Kaiser, F.J., Koopmann, T.T., Mei, H., Yalcin, B., Depienne, C., Vora, N.L., Santen, G.W.E., Davis, E.E.
- Source
- Full text @ Am. J. Hum. Genet.
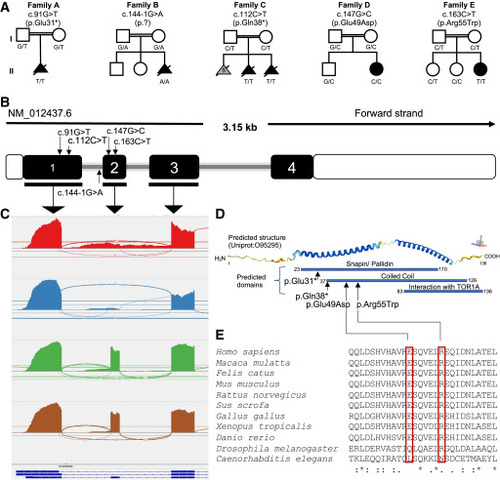
Bi-allelic variants in SNAPIN are associated with a prenatal neuroanatomical syndrome in five unrelated pedigrees (A) Five pedigrees (families A–E) harbor bi-allelic SNAPIN variants. Homozygous variants are named according to canonical transcript GenBank: NM_012437.6. Unfilled symbols, healthy individuals; filled black symbols, affected individuals; gray fill, similar phenotype in previous pregnancy but DNA sample was not available; double line, consanguinity; squares, male; circles, females; triangles, prenatal affected individuals. (B) Schematic of the SNAPIN canonical transcript (GenBank: NM_012437.6). Filled and unfilled regions represent exons (with number in white font) and untranslated regions, respectively; gray line, introns. Approximate position of the identified variants is marked with small arrows. The figure is not to scale. (C) Sashimi plot showing RNA sequencing data generated from primary fibroblasts from family B harboring the c.144−1G>A change at the exon 2 splice acceptor site. Red, proband with nonsense-mediated decay (NMD) blocking; blue, proband without NMD blocking; green and brown, unrelated controls. (D) Schematic of predicted protein structure and domains of SNAPIN. Top, predicted helical structure generated with AlphaFold.23,24 Colors represent model confidence per residue ranging from 1 to 100; dark blue, very high confidence score (>90); sky blue, high confidence (70–90); yellow, low confidence (50–70); and orange, very low confidence (<50). Axis on top right, approximate plane of view where red, green, and blue bars denote the x, y, and z axes, respectively. Bottom: predicted SNAPIN domains (DRSC/TRiP Functional Genomics Resources)25 and location of variants. (E) Multiple sequence alignment of missense variants across species. “:” indicates similar amino acids, and asterisk (∗) denotes conserved sequence identity. |
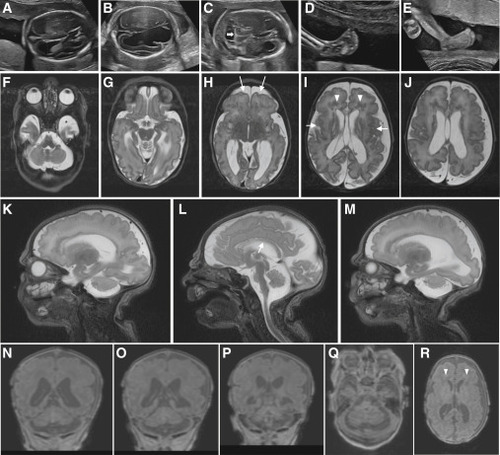
Clinical imaging of the family B and family E probands who harbor bi-allelic variants in SNAPIN (A–E) Prenatal ultrasound imaging of the family B-II:3 fetus showing progression of ventriculomegaly at (A) 19 to (B) 21 weeks of gestation, with disruption of ventral parenchyma at 21 weeks; (C) cerebellar hypoplasia at 21 weeks of gestation (white horizontal arrow); and (D and E) progression of clubfeet at (D) 19 to (E) 21 weeks. (F–R) Brain MRI of the family E-II:3 proband, born at 38 weeks of gestation, at 3 days of age showing a complex brain malformation including microcephaly with simplified gyral pattern (arrows, H), polymicrogyria (arrows, I) (G–R), thin corpus callosum (arrow, L), bilateral enlargement of lateral ventricles (H–J, N, and O), prominent periventricular white matter lesions suggestive of mixed subcortical heterotopias (arrow heads, I and R), and pronounced pontocerebellar hypoplasia (F, L, and Q). (F–J) T2-weighted axial images, (Q and R) T1-weighted axial images, (K–M) T2-weighted sagittal images, and (N–P) T1-weighted coronal images. |
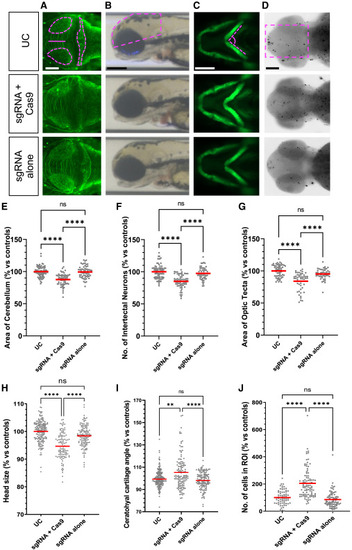
CRISPR-Cas9-injected snapin F0 mosaic mutants display neuroanatomical and craniofacial defects associated with augmented apoptosis (A–D) Representative dorsal (A and D), lateral (B), and ventral (C) images of snapin F0 mosaic larvae (sgRNA+Cas9 injected) showing anomalies of anterior structures and altered cell death compared to uninjected control (UC) and sgRNA-alone-injected embryos. Dashed magenta shape on UC marks the area measured. (E–G) Quantification of area of cerebellum (E), number of intertectal neurons (F), and area of optic tecta (G) from anti-acetylated tubulin immunostained larvae at 3 dpf. (H) Head area measurement from lateral bright-field images at 3 dpf. (I) Ceratohyal cartilage angle measurements on ventral fluorescent images at 3 dpf. (J) Number of cells undergoing apoptosis in the region of interest (ROI) at 2 dpf. Data are normalized to UC and shown as a percentage; >2 independent biological replicates were combined. Horizontal red bars, mean. Statistical test: one-way ANOVA followed by Tukey multiple comparison test (ns, nonsignificant, ∗∗p < 0.01, and ∗∗∗∗p < 0.0001). Scale bar: 100 μm. EXPRESSION / LABELING:
PHENOTYPE:
|
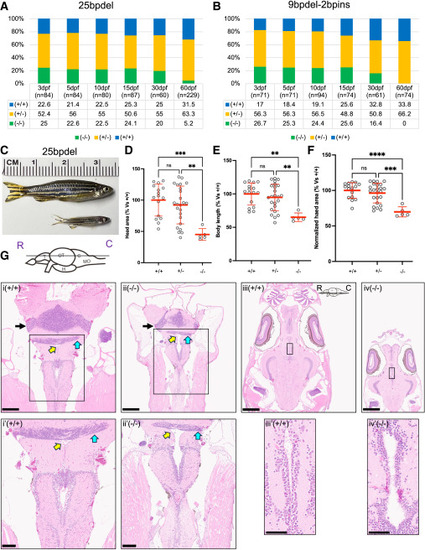
Homozygous snapin mutants show pre-adulthood lethality, reduced head size, and altered brain histology (A and B) Genotyping data of heterozygous in-cross progeny from 25bpdel (left), and 9bpdel-2bpins (right) at different time points from 3 to 60 dpf. n = number of fish genotyped at each respective time point. The table below each graph shows percentages of genotypes found at each time point (+/+, WT; +/−, Het; −/−, Hom). (C) Representative image of a WT and homozygous mutant (MT) harboring snapin 25bpdel at 70 dpf. (D–F) Quantification of juvenile zebrafish morphology at 62 dpf. Data are shown as a scatter dot plot with mean ± standard deviation. Statistical differences were assessed using one-way ANOVA followed by Tukey’s multiple comparison test (ns, nonsignificant, ∗∗p < 0.01, ∗∗∗p < 0.001, ∗∗∗∗p < 0.0001). (G) Hematoxylin and eosin (H&E)-stained brain sections of snapin 25bpdel mutants (−/−) and WT (+/+) siblings. (i and ii) WT and 25bpdel mutant brain section showing hypocellularity in the cerebellar corpus granular layer (black arrow), thinning of caudal lobe of cerebellum (cyan arrow), and rhombencephalic ventriculomegaly (yellow arrow) in homozygous mutants compared to WT. Scale bar: 250 μm. Brain schematic at the top shows approximate z-plane (R: rostral, C: caudal; T, telencephalon; OT, optic tectum; H, hypothalamus; C, cerebellum; MO, medulla oblongata). (i′ and ii′) Insets show zoomed view of thinning of caudal lobe of cerebellum (cyan arrow) and rhombencephalic ventriculomegaly (yellow arrow) in mutants compared to WT. Scale bar: 100 μm. (iii and iv) Brain sections showing dilation of periventricular nucleus of posterior tuberculum in mutants (−/−) compared to WT (+/+). Brain schematic at the top right shows approximate z-plane. Scale bar: 500 μm. (iii′ and iv′) Insets show zoomed view of altered periventricular nucleus of posterior tuberculum in mutants (−/−) compared to WT (+/+). Scale bar: 50 μm. PHENOTYPE:
|
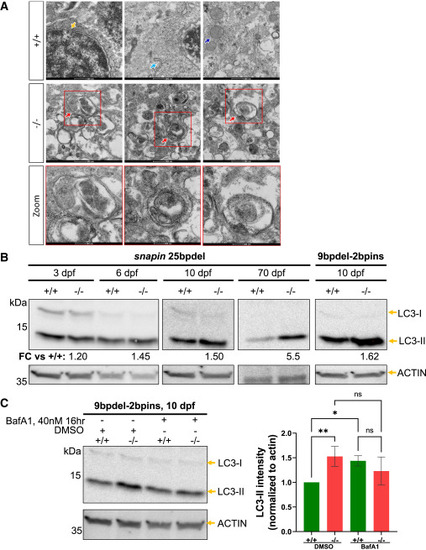
Homozygous snapin mutants show abnormal accumulation of autophagic vacuoles and progressive larval onset accumulation of autophagosomes (A) Top: TEM images from WT (+/+) fish. Orange arrow, nucleus; light blue, rough endoplasmic reticulum; dark blue, mitochondria. Scale bar: 500 nm. Middle: TEM images from 25bpdel homozygous mutant (−/−) showing abnormal accumulation of double-membrane autophagic vacuolar structures. Red arrow, autophagosome. Scale bar: 500 nm. Bottom: insets show zoomed view of vacuolar structures. Scale bar: 200 nm. (B) Longitudinal LC3 immunoblotting on 25bpdel and 9bpdel-2bpins mutants. +/+, WT; −/−, homozygous mutant. (C) LC3 immunoblotting using 40 nM bafilomycin A1 (BafA1) or DMSO for 16 h prior to harvesting at 10 dpf (+/+, WT; −/−, homozygous mutant; +, reagent present; −, reagent absent). Statistical test: one-way ANOVA followed by Fisher’s least significant difference (LSD) test (ns, nonsignificant, ∗p < 0.05, and ∗∗p < 0.01). EXPRESSION / LABELING:
PHENOTYPE:
|
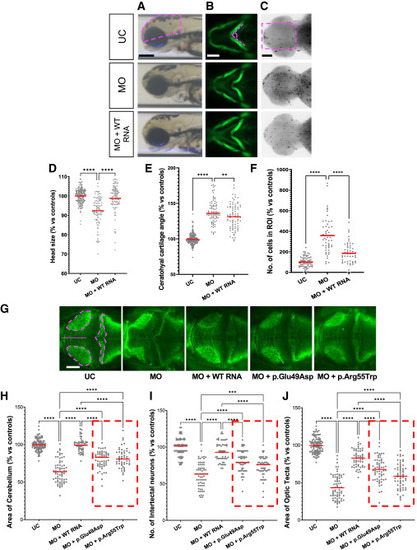
Transient suppression of endogenous snapin leads to head size reduction and craniofacial defects with a concomitant increase in apoptosis (A–C) Representative images of larvae injected with snapin MO with or without human SNAPIN WT RNA. (A) Head size area was measured from bright-field lateral images at 3 dpf, (B) ceratohyal cartilage angle was measured on fluorescent ventral images at 3 dpf, and (C) cells undergoing apoptosis were counted on dorsal images of TUNEL-stained whole-mount embryos at 2 dpf. (D–F) Quantification of (D) head size, (E) ceratohyal cartilage angle, and (F) apoptotic cells. (G) Representative dorsal fluorescent images of acetylated tubulin-immunostained larvae from in vivo complementation assays at 3 dpf. (H–J) Quantification of (H) cerebellar area, (I) number of intertectal neurons crossing the midline, and (J) area of optic tecta. Data were normalized to UC and represent >2 biological replicates. Horizontal red bars mark the mean. Statistical test: one-way ANOVA followed by the Tukey multiple comparison test (∗∗p < 0.01, ∗∗∗p < 0.001, and ∗∗∗∗p < 0.0001). Dashed magenta shape on UC marks the feature measured for quantification. Scale bar: 100 μm for all images. EXPRESSION / LABELING:
PHENOTYPE:
|
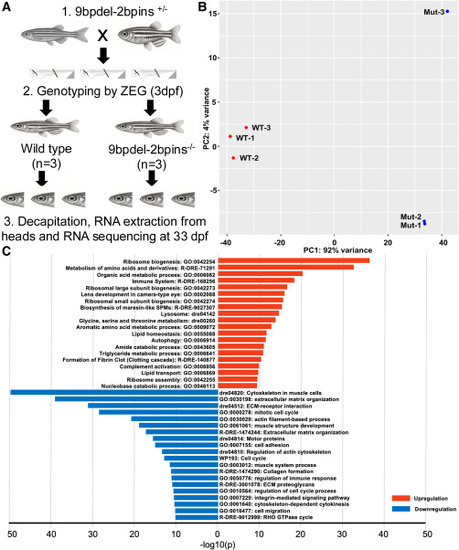
RNA-seq analysis reveals altered gene expression in homozygous 9bpdel-2bpins snapin juvenile zebrafish mutants (A) Schematic of the experimental design. Heterozygous mutants were in-crossed, and progeny were genotyped at 3 dpf and then raised to 33 dpf. At that point, juvenile WT (n = 3) and homozygous mutant (n = 3) fish were euthanized and decapitated, followed by total RNA isolation and sequencing. (B) Principal-component analysis (PCA) shows separation of datasets by genotype along PC1 (x axis), which accounts for 92% of the variance, indicating strong genotype-based differentiation. WT samples are represented by red circles; homozygous mutants by blue circles. (C) Top upregulated (red) and downregulated (blue) enriched pathways identified using Metascape.64 |