
Fig. 5
- ID
- ZDB-IMAGE-251016-30
- Antibodies
- Publication
- Yousaf et al., 2025 - Bi-allelic deleterious variants in SNAPIN, which encodes a retrograde dynein adaptor, cause a prenatal-onset neurodevelopmental disorder
- All Figures
- Figures for Yousaf et al., 2025
|
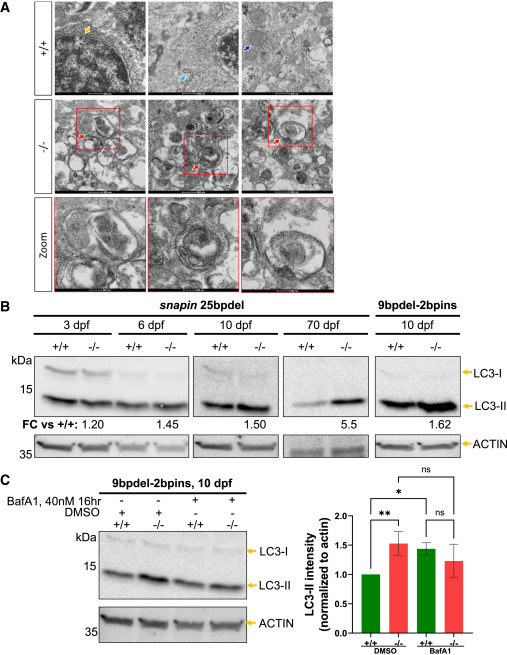
Fig. 5 Homozygous snapin mutants show abnormal accumulation of autophagic vacuoles and progressive larval onset accumulation of autophagosomes (A) Top: TEM images from WT (+/+) fish. Orange arrow, nucleus; light blue, rough endoplasmic reticulum; dark blue, mitochondria. Scale bar: 500 nm. Middle: TEM images from 25bpdel homozygous mutant (−/−) showing abnormal accumulation of double-membrane autophagic vacuolar structures. Red arrow, autophagosome. Scale bar: 500 nm. Bottom: insets show zoomed view of vacuolar structures. Scale bar: 200 nm. (B) Longitudinal LC3 immunoblotting on 25bpdel and 9bpdel-2bpins mutants. +/+, WT; −/−, homozygous mutant. (C) LC3 immunoblotting using 40 nM bafilomycin A1 (BafA1) or DMSO for 16 h prior to harvesting at 10 dpf (+/+, WT; −/−, homozygous mutant; +, reagent present; −, reagent absent). Statistical test: one-way ANOVA followed by Fisher’s least significant difference (LSD) test (ns, nonsignificant, ∗p < 0.05, and ∗∗p < 0.01).