
Fig. 3
- ID
- ZDB-IMAGE-251016-28
- Genes
- Antibodies
- Publication
- Yousaf et al., 2025 - Bi-allelic deleterious variants in SNAPIN, which encodes a retrograde dynein adaptor, cause a prenatal-onset neurodevelopmental disorder
- All Figures
- Figures for Yousaf et al., 2025
|
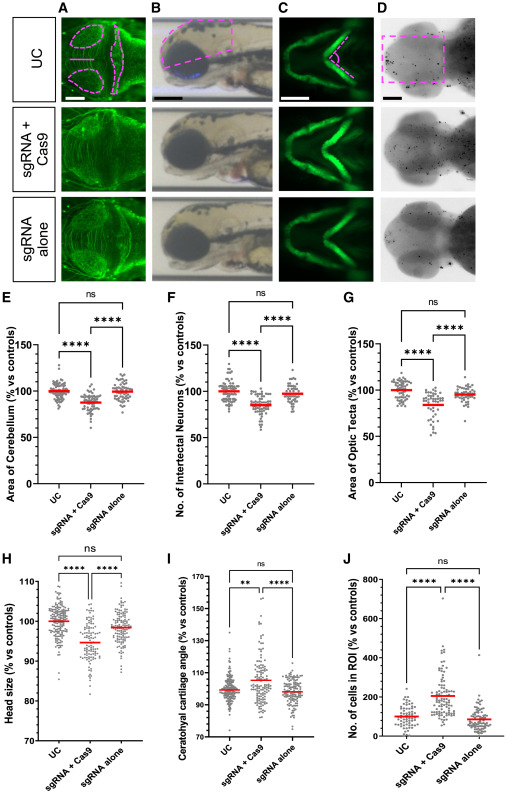
Fig. 3 CRISPR-Cas9-injected snapin F0 mosaic mutants display neuroanatomical and craniofacial defects associated with augmented apoptosis (A–D) Representative dorsal (A and D), lateral (B), and ventral (C) images of snapin F0 mosaic larvae (sgRNA+Cas9 injected) showing anomalies of anterior structures and altered cell death compared to uninjected control (UC) and sgRNA-alone-injected embryos. Dashed magenta shape on UC marks the area measured. (E–G) Quantification of area of cerebellum (E), number of intertectal neurons (F), and area of optic tecta (G) from anti-acetylated tubulin immunostained larvae at 3 dpf. (H) Head area measurement from lateral bright-field images at 3 dpf. (I) Ceratohyal cartilage angle measurements on ventral fluorescent images at 3 dpf. (J) Number of cells undergoing apoptosis in the region of interest (ROI) at 2 dpf. Data are normalized to UC and shown as a percentage; >2 independent biological replicates were combined. Horizontal red bars, mean. Statistical test: one-way ANOVA followed by Tukey multiple comparison test (ns, nonsignificant, ∗∗p < 0.01, and ∗∗∗∗p < 0.0001). Scale bar: 100 μm.