
Fig. 7
- ID
- ZDB-IMAGE-251016-32
- Publication
- Yousaf et al., 2025 - Bi-allelic deleterious variants in SNAPIN, which encodes a retrograde dynein adaptor, cause a prenatal-onset neurodevelopmental disorder
- All Figures
- Figures for Yousaf et al., 2025
|
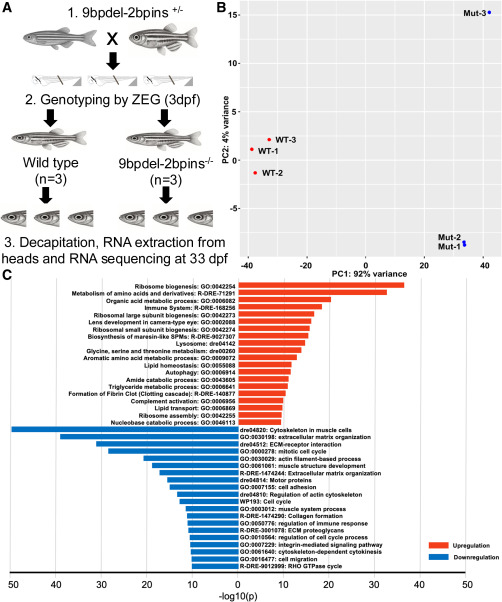
Fig. 7 RNA-seq analysis reveals altered gene expression in homozygous 9bpdel-2bpins snapin juvenile zebrafish mutants (A) Schematic of the experimental design. Heterozygous mutants were in-crossed, and progeny were genotyped at 3 dpf and then raised to 33 dpf. At that point, juvenile WT (n = 3) and homozygous mutant (n = 3) fish were euthanized and decapitated, followed by total RNA isolation and sequencing. (B) Principal-component analysis (PCA) shows separation of datasets by genotype along PC1 (x axis), which accounts for 92% of the variance, indicating strong genotype-based differentiation. WT samples are represented by red circles; homozygous mutants by blue circles. (C) Top upregulated (red) and downregulated (blue) enriched pathways identified using Metascape.64