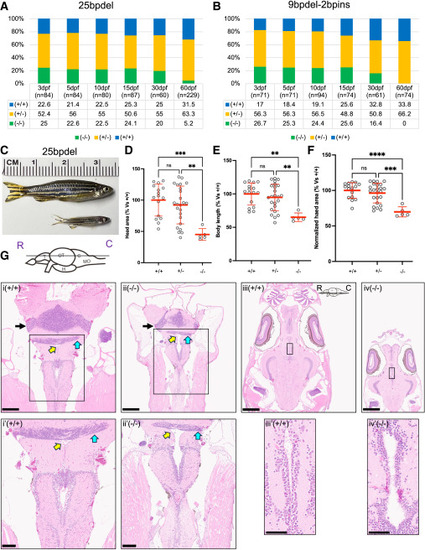
Homozygous snapin mutants show pre-adulthood lethality, reduced head size, and altered brain histology (A and B) Genotyping data of heterozygous in-cross progeny from 25bpdel (left), and 9bpdel-2bpins (right) at different time points from 3 to 60 dpf. n = number of fish genotyped at each respective time point. The table below each graph shows percentages of genotypes found at each time point (+/+, WT; +/−, Het; −/−, Hom). (C) Representative image of a WT and homozygous mutant (MT) harboring snapin 25bpdel at 70 dpf. (D–F) Quantification of juvenile zebrafish morphology at 62 dpf. Data are shown as a scatter dot plot with mean ± standard deviation. Statistical differences were assessed using one-way ANOVA followed by Tukey’s multiple comparison test (ns, nonsignificant, ∗∗p < 0.01, ∗∗∗p < 0.001, ∗∗∗∗p < 0.0001). (G) Hematoxylin and eosin (H&E)-stained brain sections of snapin 25bpdel mutants (−/−) and WT (+/+) siblings. (i and ii) WT and 25bpdel mutant brain section showing hypocellularity in the cerebellar corpus granular layer (black arrow), thinning of caudal lobe of cerebellum (cyan arrow), and rhombencephalic ventriculomegaly (yellow arrow) in homozygous mutants compared to WT. Scale bar: 250 μm. Brain schematic at the top shows approximate z-plane (R: rostral, C: caudal; T, telencephalon; OT, optic tectum; H, hypothalamus; C, cerebellum; MO, medulla oblongata). (i′ and ii′) Insets show zoomed view of thinning of caudal lobe of cerebellum (cyan arrow) and rhombencephalic ventriculomegaly (yellow arrow) in mutants compared to WT. Scale bar: 100 μm. (iii and iv) Brain sections showing dilation of periventricular nucleus of posterior tuberculum in mutants (−/−) compared to WT (+/+). Brain schematic at the top right shows approximate z-plane. Scale bar: 500 μm. (iii′ and iv′) Insets show zoomed view of altered periventricular nucleus of posterior tuberculum in mutants (−/−) compared to WT (+/+). Scale bar: 50 μm.
|
