
- Title
-
The integrated stress response promotes macrophage inflammation and migration in autoimmune diabetes
- Authors
- Wang, J.E., Muralidharan, C., Puente, A.A., Nargis, T., Enriquez, J.R., Anderson, R.M., Mirmira, R.G., Tersey, S.A.
- Source
- Full text @ Cell Commun. Signal.
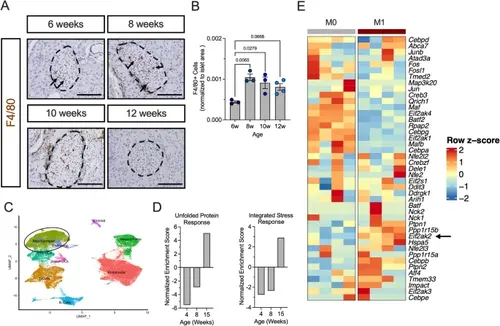
ISR regulates macrophage translation in T1D pathogenesis. A Representative images of pancreata from female NOD mice overtime stained for F4/80 (macrophage marker; brown) and counterstained with hematoxylin (blue). Dotted lines indicate islets and arrows indicate macrophages. Scale bars: 100 μm. B Quantification of F4/80 + cells in islet area; n = 3–4 biological replicates. C UMAP embeddings of a reanalysis of scRNA-Seq of islets from female NOD mice. D GSEA of the macrophage cell population identified in C showing normalized enrichment scores for Hallmark Gene Set: Unfolded Protein Response (left panel) and GO Biological Processes: Integrated Stress Response Signaling (right panel). E Heatmap of gene expression of ISR-associated genes in M0 and M1 polarized BMDMs derived from NOD mice. Arrows point to key genes of ISR kinases. Statistical tests: 1-way ANOVA with Tukey post-hoc test: B. Data are represented as mean ± SEM |
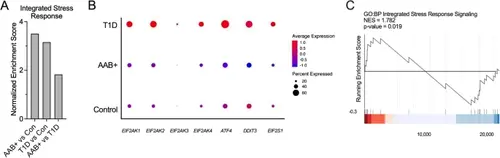
Immune cells exhibit increased ISR in samples from human with T1D. A GSEA of the immune cell population in the HPAP scRNA-seq dataset for GO Biological Processes: Integrated Stress Response Signaling. (Control: non-diabetic donors, N = 15; AAB+: single and double autoantibody positive donors, N = 10; T1D: donors with T1D, N = 9) (B) Dot plot analysis of scRNA-seq data in the HPAP of the immune cell population for key ISR genes. Dot sizes represent percentage of cells expressing the gene and the color scale represents normalized and centered average gene expression within groups. C GSEA of scRNA-seq of monocyte population of PBMCs from T1D donors (N = 46) and matched controls (N = 31) of GO Biological Processes: Integrated Stress Response Signaling |
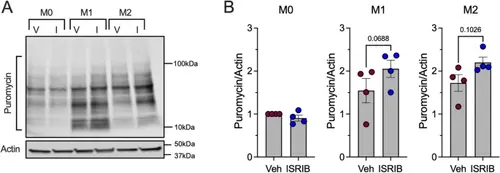
ISR alters new protein translation in macrophages. A Representative immunoblot of puromycin incorporation normalized to actin in vehicle or 50 nM ISRIB treated unpolarized (M0) and polarized (M1 or M2) BMDMs isolated from 8-week-old male C57B/6J mice; n = 4 biological replicates. B Quantification of immunoblots in I. Data is normalized to M0 vehicle. Statistical tests: Paired t-tests: B. Data are represented as mean ± SEM |
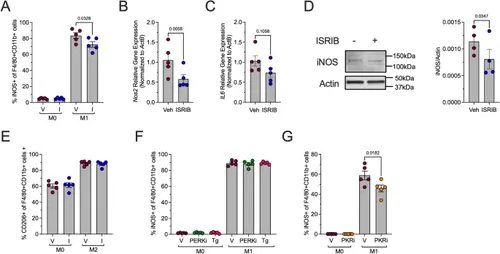
ISR and PKR inhibition reduces proinflammatory macrophages. BMDMs from male 8-week-old C57Bl/6J mice were unpolarized (M0) or polarized to M1-like proinflammatory macrophages with and without 50 nM ISRIB. A Flow cytometry analysis of iNOS + cells as a percentage of F4/80 + CD11b + cells; n = 5 biological replicates. B Relative Nos2 mRNA levels measured by qRT-PCR normalized to Actb in M1-polarized BMDMs; n = 5 biological replicates. C Relative Il6 mRNA levels measured by qRT-PCR normalized to Actb in M1-polarized BMDMs; n = 5 biological replicates. D Representative immunoblot showing iNOS and actin in M1-polarized BMDMs (left panel) and quantification of iNOS levels; n = 4 biological replicates. E Flow cytometry analysis of CD206 + cells as a percentage of F4/80 + CD11b + cells; n = 5 biological replicates. F Flow cytometry analysis of iNOS+ (M1-polarization marker) cells as a percentage of F4/80 + CD11b + cells after pretreatment with PERK inhibitor (HC-5770; PERKi) or thapsigargin (Tg); n = 5 biological replicates. G Flow cytometry analysis of iNOS+ (M1-polarization marker) cells as a percentage of F4/80 + CD11b + cells after pretreatment with PKR inhibitor (C16; PKRi); n = 5 biological replicates |
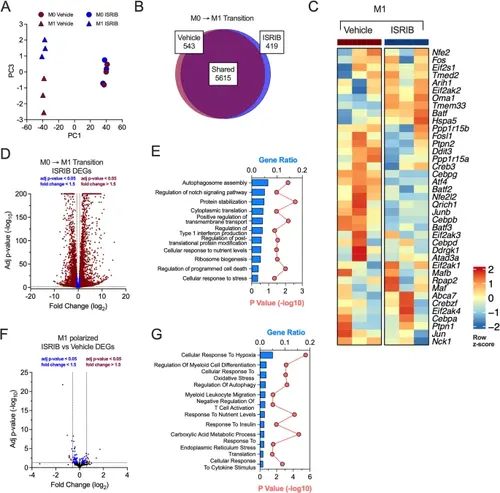
ISR inhibition reduces proinflammatory and migratory pathways. BMDMs from male 8-week-old C57Bl/6J mice were unpolarized (M0) or polarized to M1-like proinflammatory macrophages with and without 50 nM ISRIB and subjected to RNA-seq. n = 3 biological replicates. A PCA plot of RNA-seq results from vehicle- or ISRIB-treated unpolarized or M1-polarized BMDMs; n = 3 biological replicates. B Shared and uniquely expressed genes identified between vehicle- and ISRIB-treated BMDMs during M0 to M1-like transition phase. Venn diagram generated using BioVenn. C Heatmap of ISR pathway associated gene expression values. D Volcano plot of differentially expressed genes in M0 to M1-like transition in ISRIB-treated group. E GO pathway analysis of differentially expressed genes in M0 to M1-phase exclusive to ISRIB group. F Volcano plot of differentially expressed genes in ISRIB treated M1-polarized BMDMs compared to M1-polarized vehicle treated group. G GO pathway analysis of differentially expressed genes in ISRIB treated M1-polarized BMDMs when compared to vehicle group |
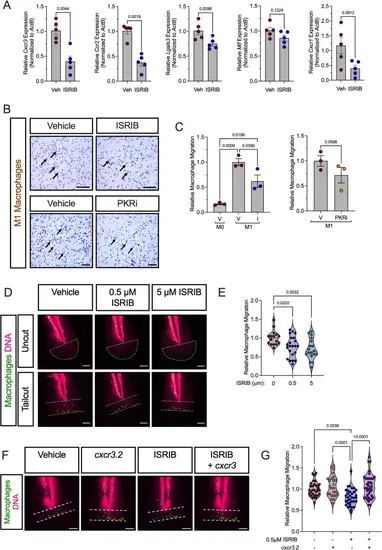
ISR and PKR inhibition impairs migration of proinflammatory macrophages. BMDMs from male 8-week-old C57Bl/6J mice were unpolarized (M0) or polarized to M1-proinflammatory macrophages in the presence or absence of 50 nM ISRIB or 1 µM C16 (PKRi). A Relative mRNA levels of key migration markers measured by qRT-PCR normalized to Actb in M1-polarized BMDMs; n = 5 biological replicates. B Representative images of in vitro Boyden chamber macrophage migration (stained with crystal violet) of unpolarized (M0) or M1-polarized macrophages in the presence or absence of ISRIB or PKRi. Arrows indicate macrophages (violet). C Quantification of the number of migrated macrophages (right panel); n = 3 biological replicates. Scale bars: 200 μm. D Representative confocal images of 3 dpf Tg(mpeg: eGFP)gl22 zebrafish that were treated with vehicle, 0.5 µM, or 5 µM ISRIB and then fixed 6 h after distal tailfin amputation. Representative images of uncut (top row) and cut (bottom row) zebrafish tailfins showing GFP-labeled macrophages (green) and TO-PRO3-labeled nuclei (magenta). (Dotted lines demarcate the tailfin region examined for macrophage counts, spanning from the notochord to the injury site). (E) Quantitation of relative number of macrophages at the tailfin injury site; n = 16–22 fish per condition. Scale bars: 100 μm. F Representative confocal images of Tg(mpeg: eGFP)gl22 zebrafish injected with a vector for macrophage-specific overexpression of cxcr3.2 at the single-cell stage, followed with vehicle or 0.5 µM ISRIB treatment before tailfin amputation showing GFP-labeled macrophages (green) and TO-PRO3-labeled nuclei (magenta); n = 25–39 fish per condition. Scale bars: 100 μm. G Quantitation of relative number of macrophages at the tail injury site. Statistical tests: Paired t-tests: A; or 1-way ANOVA with Tukey post-hoc test: C, E,and G. Data are represented as mean ± SEM |
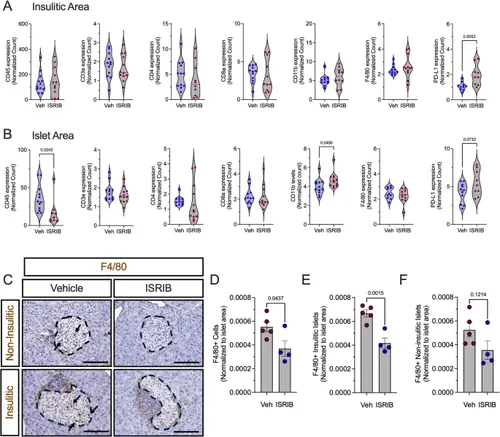
ISR Inhibition reduces islet macrophage number in prediabetic female NOD mice. Prediabetic 6-week-old female NOD mice were treated with ISRIB (2.5 mg/kg) for two weeks. A Identified protein levels in the insulitic area. B Identified protein levels in the insulin-positive area; n = 10–12 ROI from 2 mice per group. C Representative images of pancreata from ISRIB-treated NOD mice stained for F4/80 (brown), and counterstained with hematoxylin (blue). Dotted lines indicate islets and arrows indicate macrophages. Scale bars: 100 μm. D Quantification of F4/80 + cells in islet area; n = 4–5 biological replicates. E Quantification of F4/80 + cells in islets with insulitis. F Quantification of F4/80 + cells in islets without insulitis. Statistical tests: Unpaired t-tests: A-B, D-F. Data are represented as mean ± SEM |
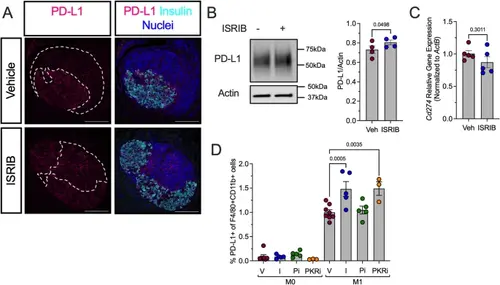
ISR inhibition increases PD-L1 protein levels in prediabetic female NOD mice. Prediabetic 6-week-old female NOD mice were treated with ISRIB (2.5 mg/kg) for two weeks. A Representative images of pancreata from vehicle- or ISRIB-treated NOD mice stained for PD-L1 (magenta), insulin (cyan), and nuclei (blue). Dotted lines indicate insulitic regions. Scale bars: 100 μm. B Representative immunoblot showing PD-L1 and actin in M1-polarized BMDMs treated with vehicle or ISRIB (left panels) and quantification of PD-L1 levels (right panel); n = 4 biological replicates. C Relative Cd274 mRNA levels measured by qRT-PCR normalized to Actb in M1-polarized BMDMs in the presence or absence of ISRIB; n = 5 biological replicates. D Flow cytometry analysis of PD-L1 + cells as a percentage of F4/80 + CD11b + BMDMs under M0 and M1 polarization conditions; n = 4–5 biological replicates. Statistical tests: Paired t-test: B and C, or 1-way ANOVA with Tukey post-hoc test: D. Data are represented as mean ± SEM |