
|
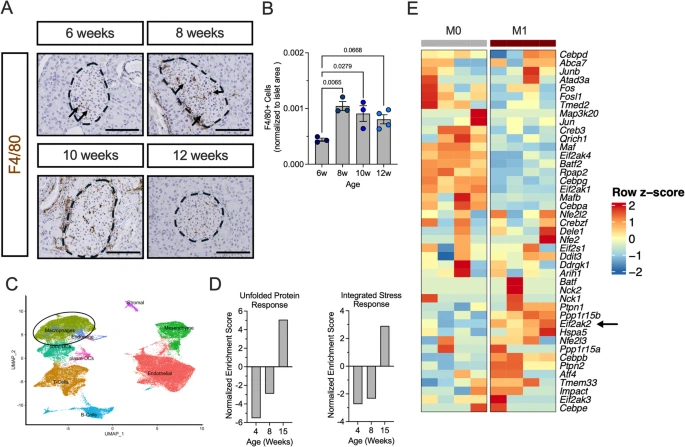
Fig. 1 ISR regulates macrophage translation in T1D pathogenesis. A Representative images of pancreata from female NOD mice overtime stained for F4/80 (macrophage marker; brown) and counterstained with hematoxylin (blue). Dotted lines indicate islets and arrows indicate macrophages. Scale bars: 100 μm. B Quantification of F4/80 + cells in islet area; n = 3–4 biological replicates. C UMAP embeddings of a reanalysis of scRNA-Seq of islets from female NOD mice. D GSEA of the macrophage cell population identified in C showing normalized enrichment scores for Hallmark Gene Set: Unfolded Protein Response (left panel) and GO Biological Processes: Integrated Stress Response Signaling (right panel). E Heatmap of gene expression of ISR-associated genes in M0 and M1 polarized BMDMs derived from NOD mice. Arrows point to key genes of ISR kinases. Statistical tests: 1-way ANOVA with Tukey post-hoc test: B. Data are represented as mean ± SEM