
|
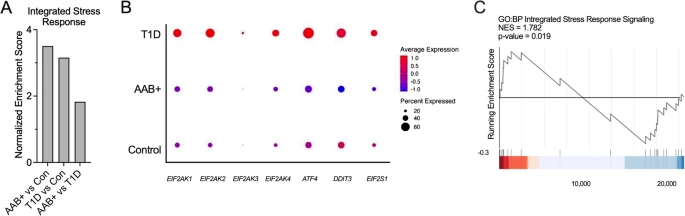
Fig. 2 Immune cells exhibit increased ISR in samples from human with T1D. A GSEA of the immune cell population in the HPAP scRNA-seq dataset for GO Biological Processes: Integrated Stress Response Signaling. (Control: non-diabetic donors, N = 15; AAB+: single and double autoantibody positive donors, N = 10; T1D: donors with T1D, N = 9) (B) Dot plot analysis of scRNA-seq data in the HPAP of the immune cell population for key ISR genes. Dot sizes represent percentage of cells expressing the gene and the color scale represents normalized and centered average gene expression within groups. C GSEA of scRNA-seq of monocyte population of PBMCs from T1D donors (N = 46) and matched controls (N = 31) of GO Biological Processes: Integrated Stress Response Signaling