
- Title
-
RAB23 loss-of-function mutation causes context-dependent ciliopathy in Carpenter syndrome
- Authors
- Leong, W.Y., Tung, W.L., Wilkie, A.O.M., Hor, C.H.H.
- Source
- Full text @ PLoS Genet.
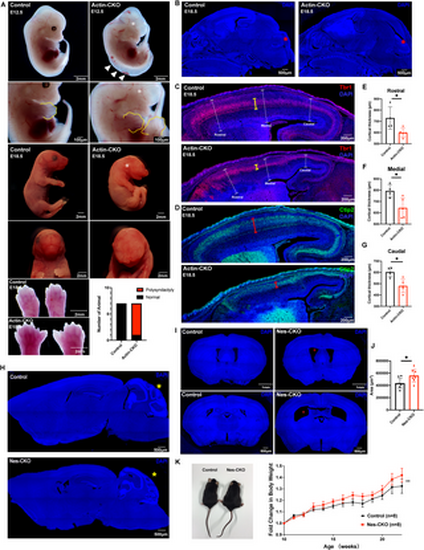
Rab23-KO mutants recapitulate the cardinal features of the CS and ciliopathy. (A) Representative images show gross morphological appearance of control and actin-CKO mutant mice at E12.5 (top) and E18.5 (bottom), respectively. White asterisks label missing or deformed eyes in actin-CKO mice, white arrowheads show the mis-patterned posterior neural tube. Bottom panel: representative close-up images of the limbs reveal polysyndactyly in actin-CKO mice at E18.5, a similar abnormality is also observed at E12.5 (yellow outline, second panel from top). Adjacent graph shows the proportion of mice exhibiting polysyndactyly. (n = 7 per group). (B) Representative DAPI-stained images depict mid-sagittal sections of the head regions of E18.5 control and actin-CKO mouse embryos. Mis-patterning of the cerebellar anlage (red asterisk) is observed in the actin-CKO embryo. (C-G) Representative mid-sagittal brain sections depict mis-patterned and thinned cerebral cortex (white dashed capped arrow) in the actin-CKO mice, which was associated with a thinning of (C) Tbr1+ (yellow capped arrow) and (D) Ctip2+ (red capped arrow) post-mitotic neuron layers. Graphs depict the quantification of the cortical thickness in control and actin-CKO mice across (E) rostral, (F) medial, and (G) caudal regions; n = 4–5 per group. Each data point represents the average thickness from 2-3 brain sections per animal. * P-value ≤ 0.05, Unpaired Student’s t-test. (H) Representative DAPI-stained images depict mid-sagittal brain sections of adult control (top) and Nes-CKO (bottom) mice respectively. Cerebellum mis-patterning (yellow asterisk) was observed in adult Nes-CKO mice. (I-J) Representative DAPI-stained images depict coronal brain sections of adult control and Nes-CKO mice, revealing an enlargement of brain ventricles (red asterisks) in Nes-CKO mice. The top panel depicts lateral ventricles at the rostral cortex. Bottom panel depicts lateral ventricles at the rostral hippocampus level. (J) Quantification of brain ventricular area in adult control and Nes-CKO mice. Each data point represents the average ventricular lumen area measured at the rostral hippocampus level across three brain sections per animal. n = 8 mice per group. * P-value ≤ 0.05, Unpaired Student’s t-test. (K) Representative image and graph show gross morphological appearance and weekly body weight measurements of adult male control and male Nes-CKO mice, respectively. Adult Nes-CKO mice appear obese. Two way ANOVA, **P value 0.01. |
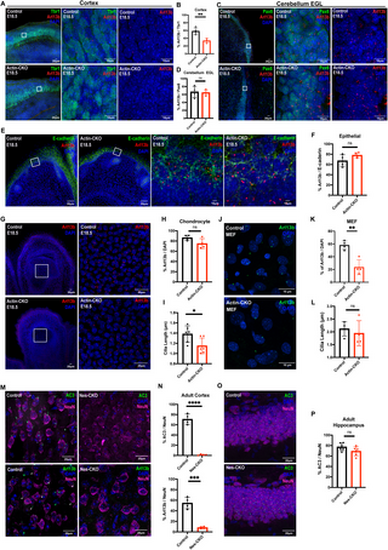
Rab23 deletion perturbs ciliation in a context-dependent manner. (A-B) Representative immunohistochemistry images (low power on left, magnification of boxed region on right) and (B) graph depicting quantification of the proportion of Arl13b+ primary cilia against Tbr1+ (green) neocortical layer VI neurons in the neocortex at E18.5. A significant two-fold reduction in the number of primary cilia is observed in the cerebral cortex of actin-CKO mouse embryos. Each data point represents the average percentage count across three brain sections per animal. n = 4 per group. ** P-value ≤ 0.01, Unpaired Student’s t-test. (C-D) Representative immunohistochemistry images and (D) graph depicting quantification of the proportion of Arl13b+ primary cilia against Pax6+ (green) granule cell precursors in the external granule layer (EGL) of cerebellum anlage at E18.5. Each data point represents the average percentage across 2-3 brain sections per animal. n = 4 per group. n.s. = not significant. Unpaired Student’s t-test. (E-F) Representative immunohistochemistry images and (F) graph depicting quantification of the proportion of Arl13b+ primary cilia against E-cadherin+ (green) epithelial cells lining the epidermal layer at E18.5. Each data point represents the average percentage across 2-3 brain sections per animal. n = 4 per group. n.s. = not significant. Unpaired Student’s t-test. (G-H) Representative immunohistochemistry images of E18.5 digits and (H) graph depicting quantification of the proportion of Arl13b+ primary cilia against chondrocytes residing in the phalanges. Each data point represents the average percentage across 3-4 brain sections per animal. n = 4 per group. n.s. = not significant. Unpaired Student’s t-test. (I) Graph depicting the measurements of cilia length in the chondrocytes of control and actin-CKO at E18.5. Graph illustrate data from 6 biological replicates in each genotype. Each data point represents the average cilia length of 150–200 cilia measured in each animal. For each animal sample, the data was collected from 3-4 images of comparable regions of interest. *P value 0.05. Unpaired Student’s t-test. (J-K) Representative immunocytochemistry images and (K) graph depicting quantification of the proportion of Arl13b+ (bottom panel green) primary cilia in the mouse embryonic fibroblasts cultured from E12.5 control and actin-CKO respectively. Each data point represents the percentage of ciliation of each independent experiment. Data represents four independent experiments. **P value 0.01. Unpaired Student’s t-test. (L) Graph depicts the measurements of cilia length in the mouse embryonic fibroblasts cultured from control and actin-CKO respectively. Data represents four independent experiments. Each data point represents the average cilia length of 20-30 cilia measured in each genotype from each independent experiment. n.s. = not significant. Unpaired Student’s t-test. (M-N) Representative immunohistochemistry images and (N) graphs depicting quantification of the proportion of AC3+ (top panel green) or Arl13b+ (bottom panel green) primary cilia against NeuN+ (pseudo-colored magenta) neurons in cerebral cortex of control and Nes-CKO mice aged 2-3 months. White arrowheads indicate primary cilia weakly express Arl13b. Similar to actin-CKO mice, neural progenitor cell-specific Rab23 knockout mutants show dramatically decreased number of ciliated neurons in the cerebral cortex of the animals. Each dot represents the average percentage across 2-3 brain sections per animal. n = 4 per group. **** P value 0.0001. Unpaired Student’s t-test. (O-P) Representative immunohistochemistry images and (P) graph depicting quantification of the proportion of AC3 + primary cilia against NeuN+ neurons in the hippocampal CA1 cells of both control and Nes-CKO mice. n = 4-5 mice in each genotype. For each sample, the percentage of ciliated cells was determined from 3-5 images of comparable regions of interest. n.s. = not significant. Unpaired Student’s t-test. |
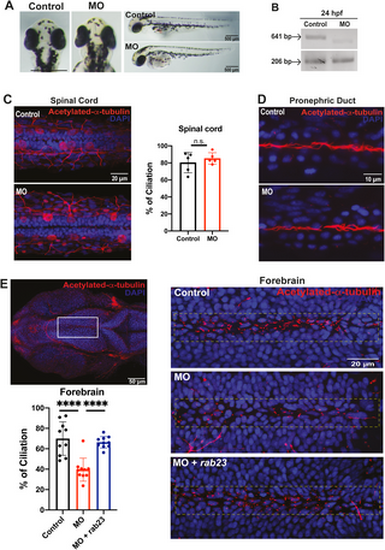
Knockdown of rab23 in zebrafish affects primary cilia formation at the rostral brain ventricle. (A) Morpholino-mediated knockdown of rab23 in zebrafish. Bright-field dorsal view microscopy images of control and morphant (MO) at 72 hpf. (B) Representative gel image showing normal splicing of rab23 in control (641 bp) or inhibited splicing in morphants 24 hour-post-fertilization (hpf), resulting in less or shorter spliced product. Actin (206 bp) was used as the internal control. (C) Representative images and graph showing largely unaffected percentage of cilia lining the central canal of the spinal cord between control and morphant. n = 5 animals for each group. Error bars depict S.D. n.s. = not significant. Unpaired Student’s t-test. (D) Representative images showing largely unaffected cilia number at the central canal of the pronephric duct between control and morphant. (E) Representative images showing an obvious reduction of cilia number present in the forebrain ventricle of morphant as compared to control. Bottom right: rab23 morphant rescued by injecting mRNA of rab23 (bottom panel). Bottom left panel: Graph presenting quantitative analysis of cilia number in the brain ventricle of control, morphants and rescue group at 24 hpf, respectively. n = 10 for each group. Error bars depict S.D. **** P value 0.0001 One-way ANOVA. EXPRESSION / LABELING:
PHENOTYPE:
|
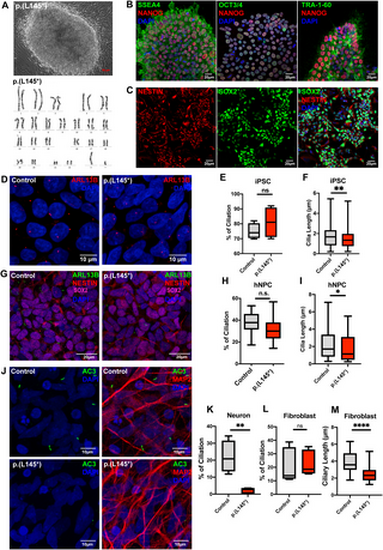
Carpenter syndrome patient-derived iPSC-differentiated neurons exhibit severely impaired ciliogenesis. (A-B) Fibroblasts isolated from skin biopsy from a Carpenter syndrome patient bearing the RAB23 biallelic p.(L145*) variant was reprogrammed into iPSC clones. (A) Top: A representative phase contrast image showing successfully reprogrammed-iPSC clone displaying a normal karyotype (bottom), and pluripotency characterized by positive (B) co-immunostainings of human stem cell markers SSEA4, NANOG, OCT3/4 and TRA-1-60 respectively. (C) Representative co-immunocytochemistry images depicting positive expression of NESTIN (red) and SOX2 (green) on neural progenitor stem cells induced from iPSCs. (D) Representative co-immunocytochemistry images depicting the iPSCs of healthy adults (control) and Carpenter syndrome patients (p.(L145*)). Cells were immunostained for the primary cilia marker ARL13B (red). (E) Graph depicts the quantification of the percentage of ciliation in iPSCs. Box plot represents data from four independent experiments. n.s. = not significant. Unpaired Student’s t-test. (F) Box plots depict the measurements of cilia length on iPSCs. Data represents the measurements of ~80-90 cilia in each genotype obtained from four independent experiments. ** P value 0.01. Unpaired Student’s t-test. (G) Representative co-immunocytochemistry images depicting healthy adult and Carpenter syndrome patient iPSC-derived human neural progenitor cells (hNPCs) co-immunostained for SOX2 (magenta), NESTIN (red) and primary cilia marker ARL13B (green). (H) Graph depicts the quantification of the percentage of ciliation in hNPCs. Box plot represents data from at least five independent experiments. n.s. = not significant. Unpaired Student’s t-test. (I) Box plot depicts the measurements of cilia length on hNPCs. Data represents the measurements of ~65–80 cilia in each genotype obtained from at least three independent experiments. *P value 0.05. Unpaired Student’s t-test. (J-K) Representative co-immunocytochemistry images depict MAP2+ (red) neurons differentiated from iPSCs of healthy adults (control) and Carpenter syndrome patients (p.(L145*)). Primary cilia were labelled by AC3 (green). (K) Graph depicts the percentage of ciliation, i.e., quantification of the proportion of ciliated neurons (AC3 + MAP2+) in the MAP2 positive neuronal population. A significant reduction in ciliation was observed in neurons bearing p.(L145*) variant. Box plot represents data from four independent experiments. ** P value 0.01 Unpaired Student’s t-test. (L) Graph depicts the quantification of the percentage of ciliation in primary fibroblast cells. The primary cilia in human fibroblast were visualised by immunostaining of acetylated-alpha-tubulin and ARL13B. Primary fibroblasts cultured from a healthy donor and a Carpenter syndrome patient with p.(L145*) variant show comparable percentages of ciliation. Box plot represents data from five independent experiments. n.s. = not significant. Unpaired Student’s t-test. (M) Box plot depicts the measurements of cilia length on fibroblast. Data represents the measurements of ~65–80 cilia in each group obtained from five independent experiments. ****P value 0.0001. Unpaired Student’s t-test. |
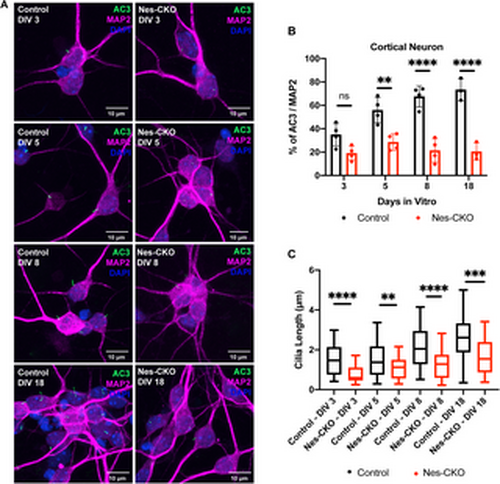
Rab23 plays critical roles in neuronal primary cilia formation and elongation. (A) Representative co-immunocytochemistry images depict the process of primary cilia elongation in the control and Nes-CKO primary cortical neuron cultures at DIV 3 to DIV18. Neurons were co-immunostained for MAP2 (magenta), and the primary cilia marker AC3 (green) respectively. (B) Graph depicts the percentage of ciliation, i.e., quantification of the proportion of ciliated neurons (AC3 + MAP2+) in the MAP2 positive neurons. Data represents three to four independent experiments. n.s. = not significant, ** P value 0.01, **** P-value ≤ 0.0001, two-way ANOVA. (C) Graph depicts the measurement of cilia length of primary cortical neurons cultures at DIV 3 to DIV18. Box plot represents data of ~70–80 cilia in each group obtained from three to four independent experiments. ** P value 0.01, *** P value 0.001, **** P-value ≤ 0.0001, two-way ANOVA. |
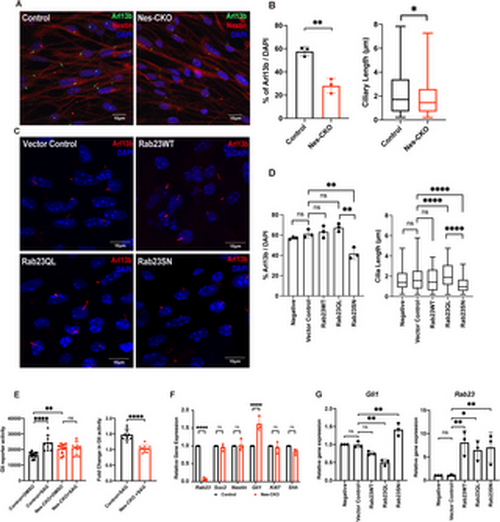
Rab23-deleted murine neural progenitor cells show disrupted ciliation and compromised response to Smo-dependent Hedgehog signaling pathway activation. (A) Representative immunocytochemistry images depict control and Nes-CKO cortical NPCs immunostained for Nestin (red) and primary cilia marker Arl13b (green). (B) Graphs depict the quantification of the percentage of ciliation and cilia length in mouse cortical neural progenitor cells culture. For the ciliation, each dot represents the average percentage value of each independent experiment. For length measurement, data represents the measurements of ~200-230 cilia in each genotype obtained from four independent experiments.** P-value ≤ 0.01. Unpaired Student’s t-test. (C) Representative co-immunocytochemistry images depicting wild-type cortical NPCs overexpressing wild-type and mutant forms of Rab23 at day 3 post-transduction. NPCs were immunostained for primary cilia marker Arl13b. (D) Graph depicts the quantification of the percentage of ciliation in wild-type cortical NPCs at day 3 following overexpression of either wild-type full-length Rab23 or its mutant forms. Box plot represents data from 3 independent experiments. Box plot depicts the measurements of cilia length on NPCs. Data represents the measurements of ~70–80 cilia in each group obtained from three independent experiments. ** P-value ≤ 0.01, *P-value ≤ 0.05, two-way ANOVA. (E) Graphs depict the (left) 7Gli:GFP reporter signals and the (right) relative fold-change in control and Nes-CKO cortical NPCs treated with 200 nM SAG and DMSO respectively for 24 hours. Data points represent triplicate readings from three independent experiments. Left: **** P-value ≤ 0.0001, ** P-value ≤ 0.01, n.s. = not significant, two-way ANOVA. Right: **** P-value ≤ 0.0001, Unpaired Student’s t-test. (F) Graph depicts the relative gene expression level of control and Nes-CKO cortical NPCs quantified by real-time qPCR. **** P-value≤0.0001, n.s. = not significant, two-way ANOVA. (G) Graphs depict the relative gene expression levels of Gli1 and Rab23 in wild-type cortical NPCs overexpressing wild-type and mutant forms of Rab23 at day 6 post-transduction. NPCs were transduced with lentiviruses carrying different overexpression construct, i.e., Rab23WT, Rab23Q68L, Rab23SN respectively. The gene expression levels of Gli1 and Rab23 at day 6 post-transduction were quantified by real-time qPCR. ** P-value ≤ 0.01, n.s. = not significant, one-way ANOVA. |
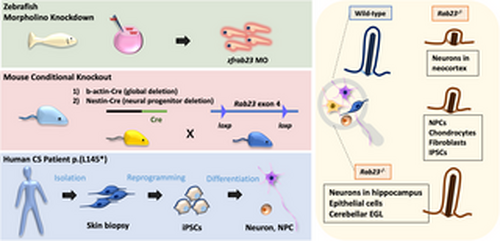
Schematic illustration of the conserved functions of Rab23 in primary cilia. Rab23 exerts evolutionarily conserved and context-specific functions in maintaining morphologically intact and functional primary cilia. Specifically, in the absence of Rab23, severe perturbations in ciliogenesis were found in distinct neuronal populations in the neocortex, while neural progenitor cells, chondrocytes, fibroblasts and iPSCs, were less severely affected. No significant changes in primary cilia prevalence were observed in Rab23 knockout hippocampus neurons, epithelial cells, or cerebellar granule cell precursors. |