
Fig. 2
- ID
- ZDB-IMAGE-250917-47
- Publication
- Leong et al., 2025 - RAB23 loss-of-function mutation causes context-dependent ciliopathy in Carpenter syndrome
- All Figures
- Figures for Leong et al., 2025
|
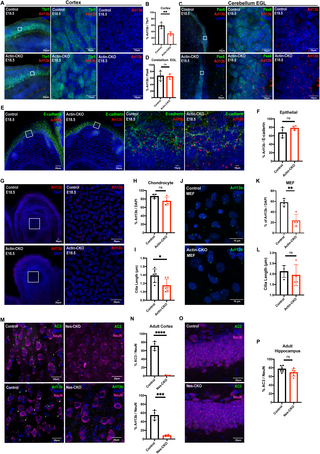
Fig. 2 Rab23 deletion perturbs ciliation in a context-dependent manner. (A-B) Representative immunohistochemistry images (low power on left, magnification of boxed region on right) and (B) graph depicting quantification of the proportion of Arl13b+ primary cilia against Tbr1+ (green) neocortical layer VI neurons in the neocortex at E18.5. A significant two-fold reduction in the number of primary cilia is observed in the cerebral cortex of actin-CKO mouse embryos. Each data point represents the average percentage count across three brain sections per animal. n = 4 per group. ** P-value ≤ 0.01, Unpaired Student’s t-test. (C-D) Representative immunohistochemistry images and (D) graph depicting quantification of the proportion of Arl13b+ primary cilia against Pax6+ (green) granule cell precursors in the external granule layer (EGL) of cerebellum anlage at E18.5. Each data point represents the average percentage across 2-3 brain sections per animal. n = 4 per group. n.s. = not significant. Unpaired Student’s t-test. (E-F) Representative immunohistochemistry images and (F) graph depicting quantification of the proportion of Arl13b+ primary cilia against E-cadherin+ (green) epithelial cells lining the epidermal layer at E18.5. Each data point represents the average percentage across 2-3 brain sections per animal. n = 4 per group. n.s. = not significant. Unpaired Student’s t-test. (G-H) Representative immunohistochemistry images of E18.5 digits and (H) graph depicting quantification of the proportion of Arl13b+ primary cilia against chondrocytes residing in the phalanges. Each data point represents the average percentage across 3-4 brain sections per animal. n = 4 per group. n.s. = not significant. Unpaired Student’s t-test. (I) Graph depicting the measurements of cilia length in the chondrocytes of control and actin-CKO at E18.5. Graph illustrate data from 6 biological replicates in each genotype. Each data point represents the average cilia length of 150–200 cilia measured in each animal. For each animal sample, the data was collected from 3-4 images of comparable regions of interest. *P value 0.05. Unpaired Student’s t-test. (J-K) Representative immunocytochemistry images and (K) graph depicting quantification of the proportion of Arl13b+ (bottom panel green) primary cilia in the mouse embryonic fibroblasts cultured from E12.5 control and actin-CKO respectively. Each data point represents the percentage of ciliation of each independent experiment. Data represents four independent experiments. **P value 0.01. Unpaired Student’s t-test. (L) Graph depicts the measurements of cilia length in the mouse embryonic fibroblasts cultured from control and actin-CKO respectively. Data represents four independent experiments. Each data point represents the average cilia length of 20-30 cilia measured in each genotype from each independent experiment. n.s. = not significant. Unpaired Student’s t-test. (M-N) Representative immunohistochemistry images and (N) graphs depicting quantification of the proportion of AC3+ (top panel green) or Arl13b+ (bottom panel green) primary cilia against NeuN+ (pseudo-colored magenta) neurons in cerebral cortex of control and Nes-CKO mice aged 2-3 months. White arrowheads indicate primary cilia weakly express Arl13b. Similar to actin-CKO mice, neural progenitor cell-specific Rab23 knockout mutants show dramatically decreased number of ciliated neurons in the cerebral cortex of the animals. Each dot represents the average percentage across 2-3 brain sections per animal. n = 4 per group. **** P value 0.0001. Unpaired Student’s t-test. (O-P) Representative immunohistochemistry images and (P) graph depicting quantification of the proportion of AC3 + primary cilia against NeuN+ neurons in the hippocampal CA1 cells of both control and Nes-CKO mice. n = 4-5 mice in each genotype. For each sample, the percentage of ciliated cells was determined from 3-5 images of comparable regions of interest. n.s. = not significant. Unpaired Student’s t-test.