
Fig. 1
- ID
- ZDB-FIG-250917-46
- Publication
- Leong et al., 2025 - RAB23 loss-of-function mutation causes context-dependent ciliopathy in Carpenter syndrome
- Other Figures
- All Figure Page
- Back to All Figure Page
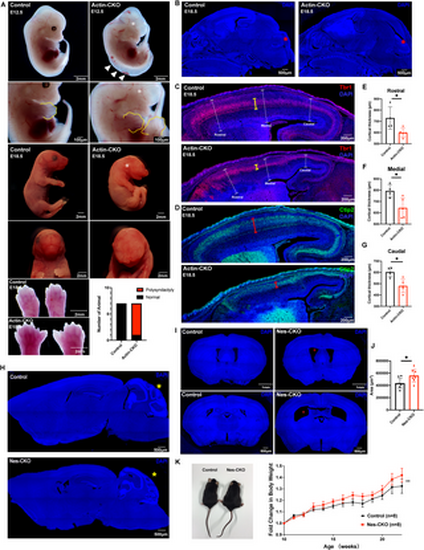
Rab23-KO mutants recapitulate the cardinal features of the CS and ciliopathy. (A) Representative images show gross morphological appearance of control and actin-CKO mutant mice at E12.5 (top) and E18.5 (bottom), respectively. White asterisks label missing or deformed eyes in actin-CKO mice, white arrowheads show the mis-patterned posterior neural tube. Bottom panel: representative close-up images of the limbs reveal polysyndactyly in actin-CKO mice at E18.5, a similar abnormality is also observed at E12.5 (yellow outline, second panel from top). Adjacent graph shows the proportion of mice exhibiting polysyndactyly. (n = 7 per group). (B) Representative DAPI-stained images depict mid-sagittal sections of the head regions of E18.5 control and actin-CKO mouse embryos. Mis-patterning of the cerebellar anlage (red asterisk) is observed in the actin-CKO embryo. (C-G) Representative mid-sagittal brain sections depict mis-patterned and thinned cerebral cortex (white dashed capped arrow) in the actin-CKO mice, which was associated with a thinning of (C) Tbr1+ (yellow capped arrow) and (D) Ctip2+ (red capped arrow) post-mitotic neuron layers. Graphs depict the quantification of the cortical thickness in control and actin-CKO mice across (E) rostral, (F) medial, and (G) caudal regions; n = 4–5 per group. Each data point represents the average thickness from 2-3 brain sections per animal. * P-value ≤ 0.05, Unpaired Student’s t-test. (H) Representative DAPI-stained images depict mid-sagittal brain sections of adult control (top) and Nes-CKO (bottom) mice respectively. Cerebellum mis-patterning (yellow asterisk) was observed in adult Nes-CKO mice. (I-J) Representative DAPI-stained images depict coronal brain sections of adult control and Nes-CKO mice, revealing an enlargement of brain ventricles (red asterisks) in Nes-CKO mice. The top panel depicts lateral ventricles at the rostral cortex. Bottom panel depicts lateral ventricles at the rostral hippocampus level. (J) Quantification of brain ventricular area in adult control and Nes-CKO mice. Each data point represents the average ventricular lumen area measured at the rostral hippocampus level across three brain sections per animal. n = 8 mice per group. * P-value ≤ 0.05, Unpaired Student’s t-test. (K) Representative image and graph show gross morphological appearance and weekly body weight measurements of adult male control and male Nes-CKO mice, respectively. Adult Nes-CKO mice appear obese. Two way ANOVA, **P value 0.01. |