
Fig. 6
- ID
- ZDB-FIG-250917-51
- Publication
- Leong et al., 2025 - RAB23 loss-of-function mutation causes context-dependent ciliopathy in Carpenter syndrome
- Other Figures
- All Figure Page
- Back to All Figure Page
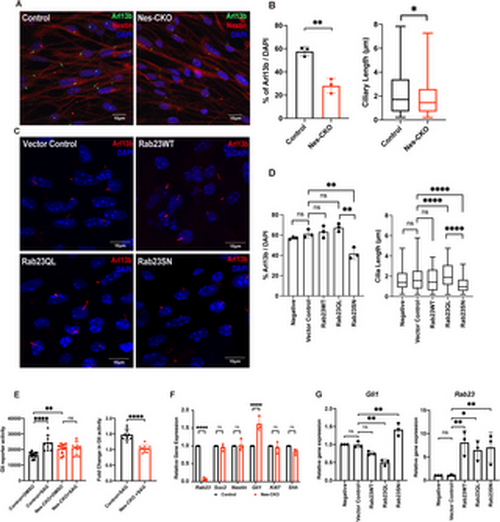
Rab23-deleted murine neural progenitor cells show disrupted ciliation and compromised response to Smo-dependent Hedgehog signaling pathway activation. (A) Representative immunocytochemistry images depict control and Nes-CKO cortical NPCs immunostained for Nestin (red) and primary cilia marker Arl13b (green). (B) Graphs depict the quantification of the percentage of ciliation and cilia length in mouse cortical neural progenitor cells culture. For the ciliation, each dot represents the average percentage value of each independent experiment. For length measurement, data represents the measurements of ~200-230 cilia in each genotype obtained from four independent experiments.** P-value ≤ 0.01. Unpaired Student’s t-test. (C) Representative co-immunocytochemistry images depicting wild-type cortical NPCs overexpressing wild-type and mutant forms of Rab23 at day 3 post-transduction. NPCs were immunostained for primary cilia marker Arl13b. (D) Graph depicts the quantification of the percentage of ciliation in wild-type cortical NPCs at day 3 following overexpression of either wild-type full-length Rab23 or its mutant forms. Box plot represents data from 3 independent experiments. Box plot depicts the measurements of cilia length on NPCs. Data represents the measurements of ~70–80 cilia in each group obtained from three independent experiments. ** P-value ≤ 0.01, *P-value ≤ 0.05, two-way ANOVA. (E) Graphs depict the (left) 7Gli:GFP reporter signals and the (right) relative fold-change in control and Nes-CKO cortical NPCs treated with 200 nM SAG and DMSO respectively for 24 hours. Data points represent triplicate readings from three independent experiments. Left: **** P-value ≤ 0.0001, ** P-value ≤ 0.01, n.s. = not significant, two-way ANOVA. Right: **** P-value ≤ 0.0001, Unpaired Student’s t-test. (F) Graph depicts the relative gene expression level of control and Nes-CKO cortical NPCs quantified by real-time qPCR. **** P-value≤0.0001, n.s. = not significant, two-way ANOVA. (G) Graphs depict the relative gene expression levels of Gli1 and Rab23 in wild-type cortical NPCs overexpressing wild-type and mutant forms of Rab23 at day 6 post-transduction. NPCs were transduced with lentiviruses carrying different overexpression construct, i.e., Rab23WT, Rab23Q68L, Rab23SN respectively. The gene expression levels of Gli1 and Rab23 at day 6 post-transduction were quantified by real-time qPCR. ** P-value ≤ 0.01, n.s. = not significant, one-way ANOVA. |