
- Title
-
The Rapid Activation of MYDGF Is Critical for Cell Survival in the Acute Phase of Retinal Regeneration in Fish
- Authors
- Sugitani, K., Omori, Y., Mokuya, T., Hosoi, S., Kobayashi, H., Miyata, K., Araiso, Y., Koriyama, Y.
- Source
- Full text @ Int. J. Mol. Sci.
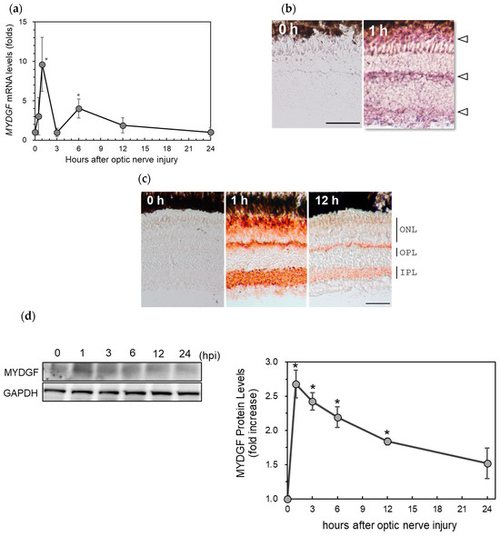
The upregulation of MYDGF (myeloid-derived growth factor) in the zebrafish retina after ONI (optic nerve injury). (a) MYDGF mRNA expression levels after ONI were determined using quantitative real-time PCR. Gene expression levels were normalized to GAPDH as an internal control, and fold changes were calculated relative to the 0 h (untreated) baseline group using the ΔΔCt method. Statistical analysis was performed using one-way ANOVAs, followed by Scheffe’s multiple-comparison tests. Data are expressed as the means ± SEMs (n = 6–7), with statistical significance set at * p < 0.05. (b) In situ hybridization of MYDGF in the zebrafish retina after ONI. MYDGF mRNA peaked in the retina 1 h after ONI, and it was observed in three locations in the retina, as indicated by the arrowheads. (c) Immunohistochemical staining of MYDGF in the zebrafish retina after ONI. Significant immunostaining peaked at 1 h in outer nuclear layers (ONLs), the border of the ONLs and outer plexiform layers (OPLs), and the inner plexiform layers (IPLs). Scale bar = 50 μm. Representative images from 3–4 independent experiments of in situ hybridization and IHC are shown. (d) Western blot analysis of MYDGF expression in the zebrafish retina at 0–24 h after ONI. MYDGF protein levels peaked in the retina 1 h after ONI. Data are expressed as the means ± SEMs (n = 3), with statistical significance set at * p < 0.05. |
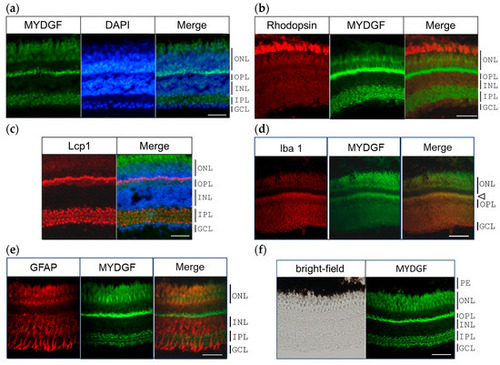
MYDGF-producing cells in the zebrafish retina 1 h after ONI. (a) Double fluorescence staining of MYDGF (green) and nuclear staining with DAPI (blue). The MYDGF-positive cells included photoreceptors in the ONL, the border of the ONL and OPL, and the cells in the IPL (Figure 2a). (b) Fluorescent double staining of the photoreceptor marker proteins rhodopsin (red) and MYDGF (green). (c) Triple fluorescence staining of MYDGF (green), nuclear staining with DAPI (blue), and leukocyte marker Lcp1 (red). Lcp1 clearly colocalized with the MYDGF-positive distribution at the ONL-OPL border regions and in the IPL. (d) The microglial marker protein Iba1 colocalized with the MYDGF-positive region at the ONL-OPL border regions (indicated by the arrowhead). (e) GFAP-positive Müller cells showed almost no co-localization with MYDGF. (f) The pigment epithelium (PE), observed as black under brightfield microscopy, was found to lack MYDGF production. Representative images from 3–4 independent experiments of IHC are shown. Scale bar = 50 μm. |
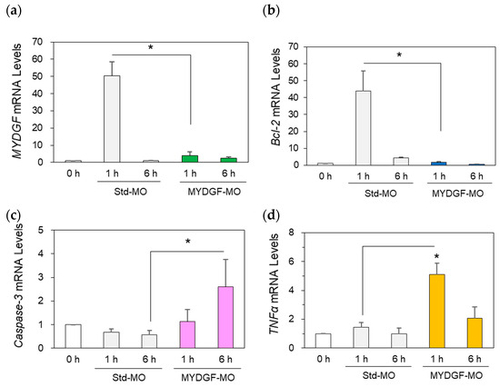
Inhibition of MYDGF expression induced neuronal apoptosis-inducing factors in the retina after ONI. Treatment with MYDGF-MO markedly suppressed MYDGF mRNA (a) and Bcl-2 mRNA (b) expression. Under MYDGF inhibition conditions, caspase-3 mRNA (c) and TNFα mRNA (d) expression noticeably increased 1 h and 6 h after ONI. Statistical analysis was performed using one-way ANOVAs, followed by Scheffe’s multiple-comparison tests. Data are expressed as the means ± SEMs (n = 6–7), with statistical significance set at * p < 0.05. |
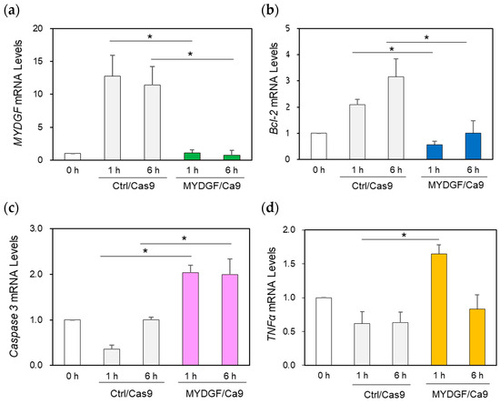
Effect of MYDGF knockdown with the CRISPR/Cas9 system using the intravitreal injection method. (a) Injection of MYDGF-specific sgRNA/Cas9 1 h before ONI markedly suppressed MYDGF mRNA expression (MYDGF/Cas9) 1 h and 6 h after ONI. (b) Under MYDGF inhibition conditions, Bcl-2 was also noticeably suppressed (MYDGF/Cas9) 1 h and 6 h after ONI. (c) Caspase-3 mRNA expression significantly increased at 1 h and 6 h in the MYDGF/Cas9 treatment group after ONI compared to the control group (Ctrl/Cas9). (d) The inflammatory factor TNFα was noticeably upregulated under the suppression of MYDGF expression 1 h after ONI (MYDGF/Cas9) compared to the control (Ctrl/Cas9). Statistical analysis was performed using one-way ANOVAs, followed by Scheffe’s multiple-comparison tests. Data are expressed as the means ± SEMs (n = 5–6), with statistical significance set at * p < 0.05. |
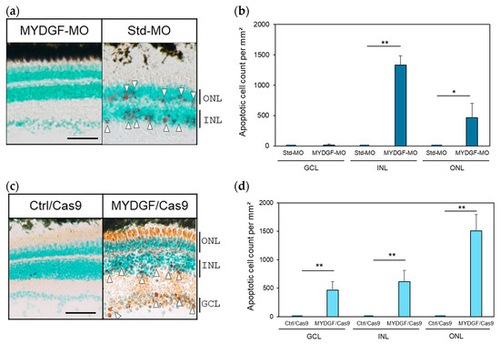
Suppression of MYDGF expression after ONI increased the number of apoptotic cells in the retina and disrupted the retinal layer structure. (a) Injection of MYDGF-specific MO (MYDGF-MO) significantly increased the number of red-stained apoptotic cells 3 h after ONI (white arrowhead); in comparison, no apoptotic cells were observed in the control-MO (Std-MO) injection group. (b) Apoptotic cells were quantified as the number of apoptotic-positive cells per mm2 in the retina. (c) Administration of MYDGF-specific sgRNA via the CRISPR/Cas9 system (MYDGF/Cas9) also significantly increased the number of red-stained apoptotic cells (white arrowhead), and most of the photoreceptors were stained red in the ONLs. No apoptotic cells were observed in the control/Cas9 injection group (Ctrl/Cas9). (d) Apoptotic cells in the retina were quantified as the number of apoptotic cells per mm2 following CRISPR/Cas9 system administration. Each nuclear layer of the retina was stained with 3% methyl green for counterstaining. Data are presented as the mean ± SEM (n = 5–6) of three independent experiments and were analyzed using one-way ANOVA. Statistical significance was set at ** p < 0.01 and * p < 0.05. ONL: outer nuclear layer; INL: inner nuclear layer; GCL: ganglion cell layer. Scale bar = 50 µm PHENOTYPE:
|
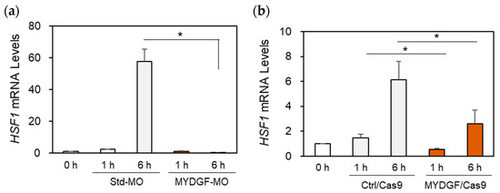
Effect of MYDGF knockdown on HSF1 expression after ONI. MYDGF-specific MO or MYDGF-specific sgRNA injections via the CRISPR/Cas9 system. (a) Knockdown with MYDGF-specific MO (MYDGF-MO) and (b) MYDGF-specific sgRNA injections using the CRISPR/Cas9 system (MYDGF/Cas9) markedly reduced HSF1 mRNA expression in the retina 6 h after ONI. Statistical analysis was performed using one-way ANOVAs, followed by Scheffe’s multiple-comparison tests. Data are expressed as the means ± SEMs (n = 5–6), with statistical significance set at * p < 0.05. |