
- Title
-
Reelin/Disabled-1 Signalling Contributes to Functional Recovery on Zebrafish After Spinal Cord Injury
- Authors
- Li, R., Sahu, S.
- Source
- Full text @ Int. J. Dev. Neurosci.
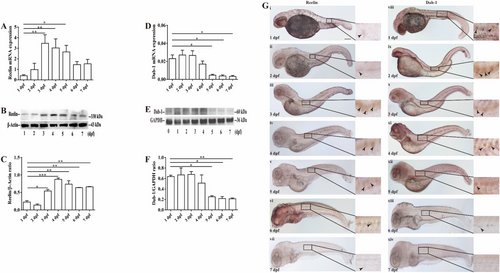
Temporal and spatial expression pattern of zebrafish Reelin and Dab-1 in the spinal cord by qPCR analysis of Reelin (A) and Dab-1 (D) mRNA between 1 and 7 dpf. Thirty embryos per group were pooled for qPCR analysis in three independent experiments. Glyceraldehyde 3-phosphate dehydrogenase (GAPDH) served as loading controls. Data represent means ± SEM, *p < 0.05, **p < 0.01, one-way ANOVA with Tukey's post hoc test. Western blot analysis of Reelin (B, C) and Dab-1 (E, F) protein between 1 and 7 dpf. Thirty embryos per group were pooled for western blot analysis in three independent experiments. GAPDH or β-actin served as loading controls. Data represent means ± SEM, *p < 0.05, **p < 0.01, ***p < 0.001, one-way ANOVA with Tukey's post hoc test. (G) Expression pattern of Reelin and Dab-1 as shown by whole-mount in situ hybridization. Arrowheads denote Reelin and Dab-1 in the spinal cord. Scale bar, 200 μm for all images. |
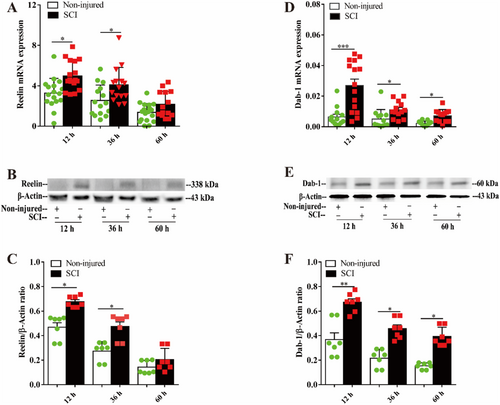
Upregulation of Reelin and Dab-1 levels in the spinal cord after SCI. qPCR (A) and western blot (B, C) analysis of Reelin caudal to lesion site in 4–6 dpf larvae. Twenty-four larvae per group were pooled for qPCR and western blot analysis in three independent experiments. GAPDH served as the loading control for qPCR analysis and β-actin served as the loading control for western blot analysis. Data represent means ± SEM, *p < 0.05, one-way ANOVA with Tukey's post hoc test. Similarly, Dab-1 levels were determined after SCI by qPCR (D) and western blot analysis (E, F). Twenty-four larvae per group were pooled for qPCR and western blot analysis in three independent experiments. GAPDH served as the loading control for qPCR analysis and β-actin served as the loading control for western blot analysis. Data represent means ± SEM, *p < 0.05, **p < 0.01, one-way ANOVA with Tukey's post hoc test. |
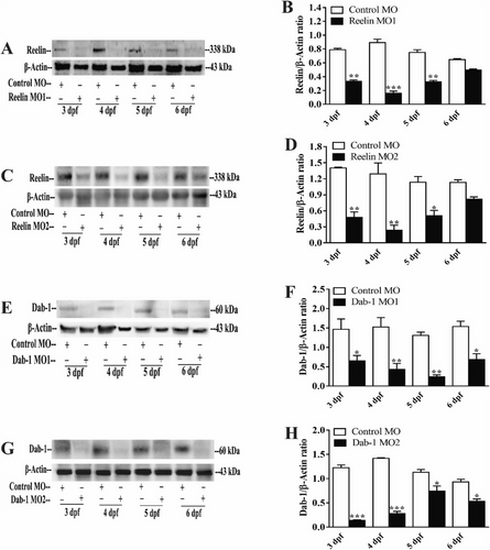
Knock-down of Reelin morpholino and Dab-1 morpholino oligonucleotides (MOs). Reelin MO1 (A, B) and MO2 (C, D) reduced Reelin expression as determined by western blot analysis. Similarly, Dab-1 MO1 (E, F) and MO2 (G, H) reduced Dab-1 expression as determined by western blot analysis. Twenty-four larvae per group were pooled for western blot analysis in three independent experiments. β-Actin served as the loading control. Data represent means ± SEM, *p < 0.05, **p < 0.01, one-way ANOVA with Tukey's post hoc test. EXPRESSION / LABELING:
PHENOTYPE:
|
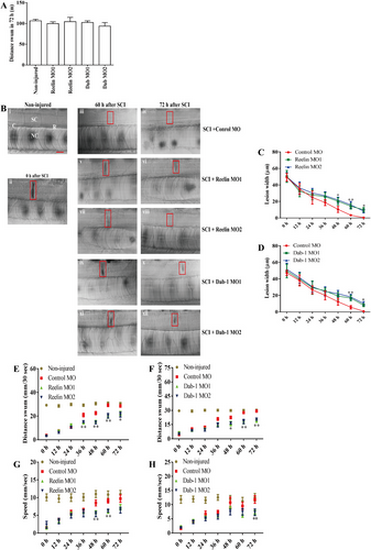
Knock-down of Reelin and Dab-1 impairs recovery of locomotor activities after SCI. (A) Total distance swum by noninjured zebrafish and zebrafish treated with Reelin MO and Dab-1 MOs without SCI was analysed by ZebraLab Video Tracker for 72 h. Forty-eight larvae were analysed per group and the experiment was performed independently three times. Data represent means ± SEM, and one-way ANOVA with Tukey's post hoc test was used to analyse the data. (B) Images of spinal cords without injury and after SCI. (i) Image of noninjured spinal cord. (ii) Image of spinal cord at 0 h after injury, (iii–iv) at 60 and 72 h after SCI in control (CON) MO–treated fish, (v–vi) at 60 and 72 h after SCI in Reelin MO1–treated fish, (vii–viii) at 60 and 72 h after SCI in Reelin MO2–treated fish, (ix–x) at 60 and 72 h after SCI in Dab-1 MO1–treated fish, (xi–xii) at 60 and 72 h after SCI in Dab-1 MO2–treated fish. Scale bar, 50 μm for all images. Red boxes denote the lesion site. SC, spinal cord; NC, notochord; C, caudal; R, rostral to the lesion site. (C, D) Quantification of lesion size (μm) in Reelin MO– and Dab-1 MO–treated fish. Forty-eight larvae/group were analysed in three independent experiments. Data represent means ± SEM, *p < 0.05, **p < 0.01 two-way ANOVA with Tukey's post hoc test. (E, F) Distance swum after the startle in Reelin MO– and Dab-1 MO–treated fish. Ninety-two larvae/group. (G, H) Velocity of escape expressed in mm/s during the startle response in Reelin MO– and Dab-1 MO–treated fish. Ninety-two larvae/group were analysed in three independent experiments. Data represent means ± SEM, *p < 0.05, **p < 0.01, **p < 0.001, one-way or two-way ANOVA with Tukey's post hoc test. |
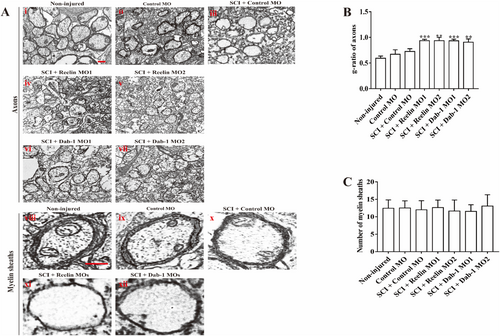
Knock-down of Reelin or Dab-1 reduces remyelination after SCI. (A) Electron micrographs of axonal profiles caudal to lesion site of control, Reelin MO– and Dab-1 MO–injected larvae at 60 h after SCI. (B) g-ratios and (C) numbers of myelin sheaths at 60 h after SCI. Five sections per animal and 12 animals were analysed in each group in three independent experiments. Data represent means ± SEM, ***p < 0.001, one-way ANOVA with Tukey's post hoc test. Scale bars, 50 μm (i–vi), 200 nm (vii–x). PHENOTYPE:
|
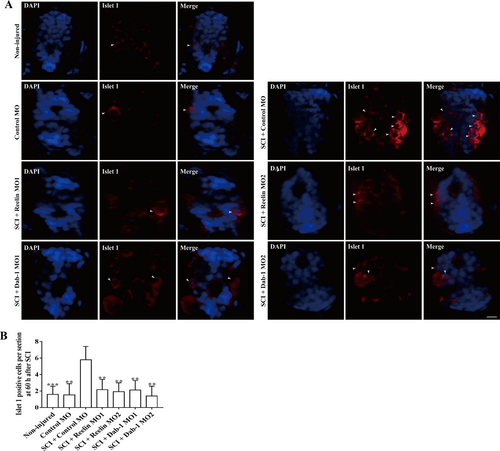
Immunohistochemical analysis of motor neuron numbers in cross-sections of spinal cords caudal to the lesion site at 60 h after SCI in Reelin MO–, Dab-1 MO– and control MO–treated larvae. (A) Micrographs show DAPI staining (left panel, blue) and Islet 1–positive motor neurons (middle panel, red) being merged (right panel) at 40× magnification. Arrowheads denote Islet 1–positive motor neurons. Scale bar, 50 μm. (B) Quantification of numbers of Islet 1–positive motor neurons in spinal cord sections after treatment with Reelin, Dab-1 and control MOs. Data are from 60 sections per group. Five sections were analysed per animal and 12 animals were in each group in three independent experiments. Data represent means ± SEM, SCI plus Con MO versus all groups, ***p < 0.001, one-way ANOVA with Tukey's post hoc test. PHENOTYPE:
|