
Fig. 6
- ID
- ZDB-IMAGE-250829-30
- Publication
- Li et al., 2025 - Reelin/Disabled-1 Signalling Contributes to Functional Recovery on Zebrafish After Spinal Cord Injury
- All Figures
- Figures for Li et al., 2025
|
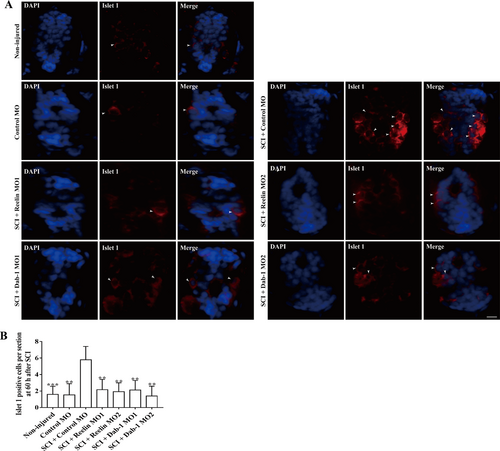
Fig. 6 Immunohistochemical analysis of motor neuron numbers in cross-sections of spinal cords caudal to the lesion site at 60 h after SCI in Reelin MO–, Dab-1 MO– and control MO–treated larvae. (A) Micrographs show DAPI staining (left panel, blue) and Islet 1–positive motor neurons (middle panel, red) being merged (right panel) at 40× magnification. Arrowheads denote Islet 1–positive motor neurons. Scale bar, 50 μm. (B) Quantification of numbers of Islet 1–positive motor neurons in spinal cord sections after treatment with Reelin, Dab-1 and control MOs. Data are from 60 sections per group. Five sections were analysed per animal and 12 animals were in each group in three independent experiments. Data represent means ± SEM, SCI plus Con MO versus all groups, ***p < 0.001, one-way ANOVA with Tukey's post hoc test.