
Fig. 1
- ID
- ZDB-IMAGE-250829-25
- Genes
- Publication
- Li et al., 2025 - Reelin/Disabled-1 Signalling Contributes to Functional Recovery on Zebrafish After Spinal Cord Injury
- All Figures
- Figures for Li et al., 2025
|
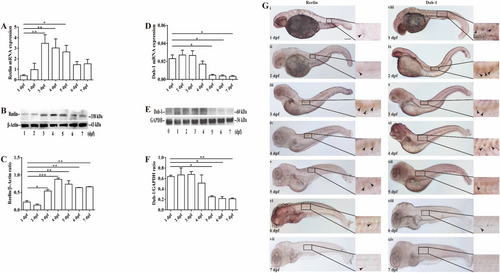
Fig. 1 Temporal and spatial expression pattern of zebrafish Reelin and Dab-1 in the spinal cord by qPCR analysis of Reelin (A) and Dab-1 (D) mRNA between 1 and 7 dpf. Thirty embryos per group were pooled for qPCR analysis in three independent experiments. Glyceraldehyde 3-phosphate dehydrogenase (GAPDH) served as loading controls. Data represent means ± SEM, *p < 0.05, **p < 0.01, one-way ANOVA with Tukey's post hoc test. Western blot analysis of Reelin (B, C) and Dab-1 (E, F) protein between 1 and 7 dpf. Thirty embryos per group were pooled for western blot analysis in three independent experiments. GAPDH or β-actin served as loading controls. Data represent means ± SEM, *p < 0.05, **p < 0.01, ***p < 0.001, one-way ANOVA with Tukey's post hoc test. (G) Expression pattern of Reelin and Dab-1 as shown by whole-mount in situ hybridization. Arrowheads denote Reelin and Dab-1 in the spinal cord. Scale bar, 200 μm for all images.