
Fig. 2
- ID
- ZDB-IMAGE-250829-26
- Genes
- Publication
- Li et al., 2025 - Reelin/Disabled-1 Signalling Contributes to Functional Recovery on Zebrafish After Spinal Cord Injury
- All Figures
- Figures for Li et al., 2025
|
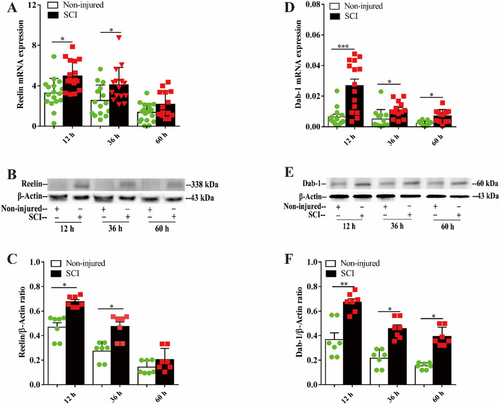
Fig. 2 Upregulation of Reelin and Dab-1 levels in the spinal cord after SCI. qPCR (A) and western blot (B, C) analysis of Reelin caudal to lesion site in 4–6 dpf larvae. Twenty-four larvae per group were pooled for qPCR and western blot analysis in three independent experiments. GAPDH served as the loading control for qPCR analysis and β-actin served as the loading control for western blot analysis. Data represent means ± SEM, *p < 0.05, one-way ANOVA with Tukey's post hoc test. Similarly, Dab-1 levels were determined after SCI by qPCR (D) and western blot analysis (E, F). Twenty-four larvae per group were pooled for qPCR and western blot analysis in three independent experiments. GAPDH served as the loading control for qPCR analysis and β-actin served as the loading control for western blot analysis. Data represent means ± SEM, *p < 0.05, **p < 0.01, one-way ANOVA with Tukey's post hoc test.