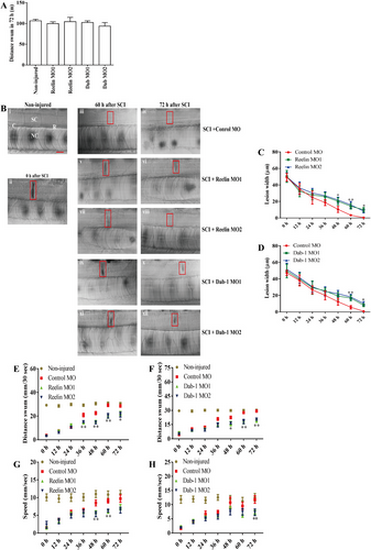
Knock-down of Reelin and Dab-1 impairs recovery of locomotor activities after SCI. (A) Total distance swum by noninjured zebrafish and zebrafish treated with Reelin MO and Dab-1 MOs without SCI was analysed by ZebraLab Video Tracker for 72 h. Forty-eight larvae were analysed per group and the experiment was performed independently three times. Data represent means ± SEM, and one-way ANOVA with Tukey's post hoc test was used to analyse the data. (B) Images of spinal cords without injury and after SCI. (i) Image of noninjured spinal cord. (ii) Image of spinal cord at 0 h after injury, (iii–iv) at 60 and 72 h after SCI in control (CON) MO–treated fish, (v–vi) at 60 and 72 h after SCI in Reelin MO1–treated fish, (vii–viii) at 60 and 72 h after SCI in Reelin MO2–treated fish, (ix–x) at 60 and 72 h after SCI in Dab-1 MO1–treated fish, (xi–xii) at 60 and 72 h after SCI in Dab-1 MO2–treated fish. Scale bar, 50 μm for all images. Red boxes denote the lesion site. SC, spinal cord; NC, notochord; C, caudal; R, rostral to the lesion site. (C, D) Quantification of lesion size (μm) in Reelin MO– and Dab-1 MO–treated fish. Forty-eight larvae/group were analysed in three independent experiments. Data represent means ± SEM, *p < 0.05, **p < 0.01 two-way ANOVA with Tukey's post hoc test. (E, F) Distance swum after the startle in Reelin MO– and Dab-1 MO–treated fish. Ninety-two larvae/group. (G, H) Velocity of escape expressed in mm/s during the startle response in Reelin MO– and Dab-1 MO–treated fish. Ninety-two larvae/group were analysed in three independent experiments. Data represent means ± SEM, *p < 0.05, **p < 0.01, **p < 0.001, one-way or two-way ANOVA with Tukey's post hoc test.
|
