
- Title
-
ATF7IP/SETDB1-mediated epigenetic programming regulates thymic homing and T lymphopoiesis of hematopoietic progenitors during embryogenesis
- Authors
- Chen, W., Wu, J., She, P., Li, J., Lan, Y., Hu, X., Huangfu, Y., Wu, C., Jin, D., Xie, P., Zhuang, G., Wu, Y., Zhang, Y., Zon, L.I., Zhu, P., Zhong, T.P.
- Source
- Full text @ Nat. Commun.
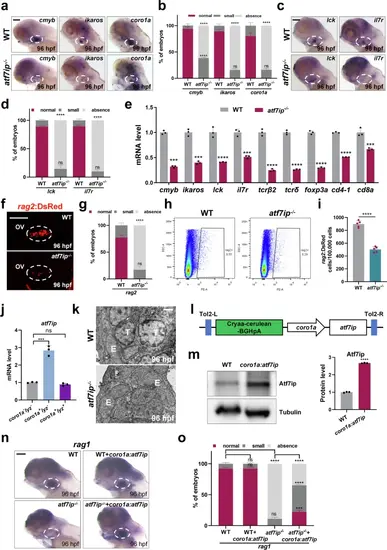
atf7ip−/− mutants exhibit a reduction in T lymphocytes during embryogenesis.a, b WISH analysis of cmyb, ikaros and coro1a in thymus (white circles) of atf7ip−/− mutants and WT at 96 hpf. Red, dark gray and light gray squares indicate normal (cmyb: 45-90; ikaros: 30-60; coro1a: 45-90), small (cmyb: 10-45; ikaros: 10-30; coro1a: 20-45), and absence (cmyb: 0-10; ikaros: 0-10; coro1a: 0-20) foci in thymus. Quantifications of WISH phenotype distribution are shown in b 3 independent experiments. c, d WISH analysis of lck and il7r in thymus (white circles) of atf7ip−/− mutants and WT at 96 hpf. Red, dark gray and light gray squares indicate normal (30-60), small (10-30), and absence (0-10) foci in thymus. Quantifications are shown in (d, 3 independent experiments. e qPCR analysis of ikaros, cmyb, lck, il7r, tcrβ2, tcrδ, foxp3a, cd4-1 and cd8a in whole embryos of WT and atf7ip−/− mutants at 96 hpf, n = 3. f, g Confocal imaging of thymic lymphocytes (white circles) in WT and atf7ip−/− mutants on Tg(rag2:DsRed) background at 96 hpf. Quantification is shown in (g), 3 independent experiments. h, i Representative FACS of rag2:DsRed cells in WT and atf7ip−/− mutants at 96 hpf. Quantification is shown in (i), n = 5. j qPCR analysis of atf7ip in coro1a-lyz-, coro1a+lyz- and coro1a+lyz+ cells at 60 hpf, n = 3. k TEM analysis of thymic cellular structure in WT and atf7ip−/− mutants at 96 hpf. Scale bar, 10 μm. T, T lymphocytes; E, thymic epithelial cells. l Schematic of full-length atf7ip gene driven by the coro1a promoter on tol2 vector. m Immunoblot and quantification of Atf7ip protein level in coro1a:atf7ip/tol2-injected embryos at 96 hpf, n = 3. n, o WISH analysis of rag1 in thymus (white circles) of WT, atf7ip−/− mutants and coro1a:atf7ip/tol2-injected embryos at 96 hpf. Red, dark gray and light gray squares indicate normal (45-90), small (10-45), and absence (0-10) foci in thymus. Quantifications of WISH are shown in (o), 3 independent experiments. Scale bar, 100 μm (a, c, f, n). Quantifications (b, d, e, g, i, j, m, o) are represented as mean ± SD; ns, P > 0.05, *P < 0.05, **P < 0.01, ***P < 0.001, ****P < 0.0001. Student’s t test (unpaired, two-tailed). Source data are provided as a Source Data file. |
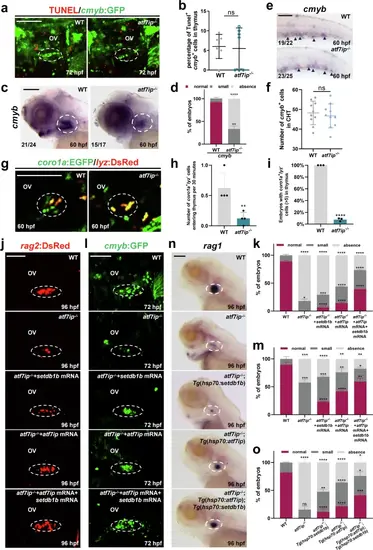
Atf7ip interacts with Setdb1 to coordinate T lymphoid progenitor migration and differentiation.a, b Double immunostaining showing cmyb:GFP+/TUNEL+ cells in thymus (white circles) of WT and atf7ip−/− mutants at 72 hpf. Quantification is shown in (b), n = 7. c, d WISH analysis of cmyb in thymus (white circles) of atf7ip−/− mutants and siblings at 60 hpf. Red, dark gray and light gray squares indicate normal (45-90), small (10-45), and absence (0-10) foci in thymus, respectively. Quantifications of WISH phenotype distribution are shown in (d), 3 independent experiments. e, f WISH analysis of cmyb in atf7ip−/− CHTs and WT CHTs (black arrows) at 60 hpf. Quantification of cmyb+ cells in thymus is shown in (f), n = 10. g, h Confocal imaging exhibiting coro1a:EGFP+/lyz:DsRed- cells entering the thymus (white circles) within 30 min in WT and atf7ip− embryos at 60 hpf. Quantifications of coro1a:EGFP+/lyz:DsRed- cells entering the thymus are shown in (h), n = 4. i Quantifications of embryos with coro1a:EGFP+/lyz:DsRed- cells ( > 5) in thymus of WT and atf7ip−/− embryos at 84 hpf, n = 3. j, k Confocal imaging exhibiting rag2:DsRed+ cells in thymus (white circles) of WT, atf7ip−/− mutants, setdb1b mRNA-injected atf7ip−/− mutants, atf7ip mRNA-injected atf7ip−/− mutants, setdb1b/atf7ip mRNA-injected atf7ip−/− mutants at 96 hpf. Quantifications of embryos distribution with rag2+ cells are shown in (k), 3 independent experiments. l, m Confocal imaging exhibiting cmyb:GFP+ cells in thymus (white circles) of WT, atf7ip−/− mutants, setdb1b mRNA-injected atf7ip−/− mutants, atf7ip mRNA-injected atf7ip−/− mutants, setdb1b/atf7ip mRNA-injected atf7ip−/− mutants at 72 hpf. Quantifications of cmyb+ cells are shown in (m), 3 independent experiments. n, o WISH analysis of rag1 in thymus (white circles) in WT, atf7ip−/− mutants, heat-shocked atf7ip−/−;Tg(hsp70:setdb1b) embryos, heat-shocked atf7ip−/−;Tg(hsp70:atf7ip), and heat-shocked atf7ip−/−;Tg(hsp70:atf7ip);Tg(hsp70:setdb1b) embryos at 96 hpf. Red, dark gray and light gray squares indicate normal (45-90), small (10-45), and absence (0-10) foci in thymus, respectively. Quantifications are shown in (o), 3 independent experiments. Scale bar, 100 μm (a, c, e, g, j, l, n). Quantifications (b, d, f, h, i, k, m, o) are represented as mean ± SD; ns, P > 0.05, *P < 0.05, **P < 0.01, ***P < 0.001, ****P < 0.0001. Student’s t test (unpaired, two-tailed). Source data are provided as a Source Data file. |

setdb1b−/− mutation causes a defect in T lymphopoiesis. a qPCR analysis of the relative mRNA levels of setdb1b in coro1a-lyz-, coro1a+lyz- and coro1a+lyz+ cells at 60 hpf, n = 3. b–f WISH analysis of lck, il7r, ikaros and coro1a in thymus (white circles) of setdb1b−/− mutants and WT at 96 hpf. Red, dark gray and light gray squares indicate normal (lck: 30-60; il7r: 30-60; ikaros: 30-60; and coro1a: 45-90), small (lck: 10-30; il7r: 10-30; ikaros: 10-30; and coro1a: 20-45), and absence (lck: 0-10; il7r: 0-10; ikaros: 0-10; and coro1a: 0-20) foci in thymus, respectively. WISH quantifications are shown in (c-f), 3 independent experiments. g qPCR analysis of the relative mRNA levels of ikaros, lck, il7r, tcrα, tcrδ and foxp3a in whole embryos of setdb1b−/− mutants and siblings at 96 hpf, n = 3. h, i Confocal imaging showing lymphocyte in thymus (white circles) of control MO or setdb1b MO-injected WT embryos in Tg(rag2:DsRed) background at 96 hpf. Quantification of rag2+ cells is shown in (i), 3 independent experiments. j, k Representative FACS of rag2:DsRed cells in control MO or setdb1b MO-injected WT embryos at 96 hpf. Quantification of rag2+ cells is shown in (k), n = 5. l Schematic diagram showing the construct of full-length atf7ip gene driven by the coro1a promoter on tol2 vector. m Immunoblot and quantification depicting the protein level of Setdb1 in embryos injected with coro1a:setdb1b/tol2 constructs at 96 hpf, n = 3. n, o WISH analysis of rag1 in thymus (white circles) of WT, setdb1b−/− mutants and embryos injected with coro1a:setdb1b/tol2 constructs at 96 hpf. Red, dark gray and light gray squares indicate normal (45-90), small (10-45), and absence (0-10) foci in thymus, respectively. Quantifications of WISH are shown in (o), 3 independent experiments. Scale bar, 100 μm (b, h, n). Quantifications (a, c–f, g, i, k, m, o) are represented as mean ± SD; ns, P > 0.05, *P < 0.05, **P < 0.01, ***P < 0.001, ****P < 0.0001. Student’s t test (unpaired, two-tailed). Source data are provided as a Source Data file. |

ccr9a induction in atf7ip−/− embryos restores the thymic migration of T lymphoid progenitors.a Schematic workflow of RNA-seq from FACS-sorted cmyb+ cells in WT and atf7ip−/− mutants on Tg(cmyb:GFP) background at 72 hpf. b Volcano plot showing genes with increased expression (green) and decreased expression (brown) (Fold change > 1.5; P-value < 0.05) in atf7ip−/− mutants versus WT at 72 hpf. P-values were calculated using DESeq2 with two-sided Wald test and adjusted for multiple comparisons (Benjamini-Hochberg). c Heatmap showing the expression level of lymphopoiesis-related signature genes in atf7ip−/− mutants and WT at 72 hpf. d WISH analysis of ccr9a in CHT region of WT, atf7ip−/− and setdb1b−/− mutants at 60 hpf. e Schematic diagram showing the construct of full-length ccr9a gene driven by hsp70 promoter on tol2 vector (up). Fluorescent microscopy depicting the expression of hsp70:ccr9a-mCherry in WT at 96 hpf (down). f Immunoblot and quantification of Ccr9 protein level in WT and heat-shocked Tg(hsp70:ccr9a) embryos at 96 hpf, n = 3. g qPCR analysis of the relative mRNA levels of ccr9a in WT, atf7ip−/− mutants, heat-shocked Tg(hsp70:ccr9a) and atf7ip−/−;Tg(hsp70:ccr9a) embryos at 96 hpf, n = 3. h WISH analysis of ccr9a in thymus (white circles) of WT, atf7ip−/− mutants, heat-shocked Tg(hsp70:ccr9a) and heat-shocked atf7ip−/−;Tg(hsp70:ccr9a) embryos at 96 hpf, 3 independent experiments. i Number of coro1a:EGFP+/lyz:DsRed- cells entering the thymus every 30 min in WT, atf7ip−/− mutants, heat-shocked Tg(hsp70:ccr9a) and atf7ip−/−;Tg(hsp70:ccr9a) embryos, n = 3. j, k Confocal imaging showing lymphoid progenitors in thymus (white circles) of WT, atf7ip−/− mutants, heat-shocked Tg(hsp70:ccr9a) and atf7ip−/−;Tg(hsp70:ccr9a) embryos in cmyb:GFP transgenic background at 72 hpf. Quantification of cmyb+ cells is shown in (k), n = 6. l, m WISH analysis of cmyb and rag1 in thymus (white circles) of WT, atf7ip−/− mutants and heat-shocked atf7ip−/−;Tg(hsp70:ccr9a) embryos at 96 hpf. Red, dark gray and light gray squares indicate normal (cmyb/rag1: 45-90), small (cmyb/rag1: 10-45), and absence (cmyb/rag1: 0-10) foci in thymus, respectively. Quantifications of WISH distribution are shown in (m), 3 independent experiments. Scale bar, 100 μm (d, e, h, j, l). Quantifications (f, g, i, k, m) are represented as mean ± SD; ns, P > 0.05, *P < 0.05, **P < 0.01, ***P < 0.001, ****P < 0.0001. Student’s t test (unpaired, two-tailed). Source data are provided as a Source Data file. |

T cell differentiation and migration are impaired due to irf4a reduction in atf7ip−/− mutants.a WISH analysis of irf4a in CHT of WT, atf7ip−/− mutants and setdb1b−/− mutants at 60 hpf. b Schematic diagram showing the construct of full-length irf4a gene driven by hsp70 promoter on tol2 vector (up). Fluorescent microscopy depicting the expression of hsp70:irf4a-mCherry in WT at 96 hpf (down). c Immunoblot and quantification depicting the protein level of Irf4 in WT and heat-shocked Tg(hsp70:irf4a)embryos at 96 hpf, n = 3. d qPCR analysis of ccr9a, lck, il7r, cd4-1 and tcra in whole embryos of WT, atf7ip−/− mutants and heat-shocked atf7ip−/−;Tg(hsp70:irf4a) embryos at 96 hpf, n = 3. e, f WISH analysis of cmyb and rag1 in thymus (white circles) of WT, atf7ip−/− mutants and heat-shocked atf7ip−/−;Tg(hsp70:irf4a) embryos at 96 hpf. Red, dark gray and light gray squares indicate normal (cmyb/rag1: 45-90), small (cmyb/rag1: 10-45), and absence (cmyb/rag1: 0-10) foci in thymus, respectively. Quantifications of WISH distribution are shown in (f), 3 independent experiments. g Number of coro1a:EGFP+/lyz:DsRed- cells entering the thymus every 30 min in WT, atf7ip−/− mutants, heat-shocked Tg(hsp70:irf4a) and atf7ip−/−;Tg(hsp70:irf4a) embryos, n = 3. h, i Confocal imaging showing lymphoid progenitors in thymus (white circles) of WT, atf7ip−/− mutants, heat-shocked Tg(hsp70:irf4a) and atf7ip−/−;Tg(hsp70:irf4a) embryos in coro1a:EGFP/lyz:DsRed transgenic background at 72 hpf. Quantification is shown in (i), n = 5. j, k WISH displaying cmyb and rag1 expression in thymus (white circles) in WT, atf7ip−/− mutants and atf7ip−/− mutants injected with coro1a-irf4a/tol2 constructs at 96 hpf. Red, dark gray and light gray squares indicate normal (cmyb/rag1: 45-90), small (cmyb/rag1: 10-45), and absence (cmyb/rag1: 0-10) foci in thymus, respectively. Quantifications of WISH phenotype distribution are shown in (k), 3 independent experiments. Scale bar, 100 μm (a, b, e, h, j). Quantifications (c, d, f, g, i, k) are represented as mean ± SD; ns, P > 0.05, *P < 0.05, **P < 0.01, ***P < 0.001, ****P < 0.0001. Student’s t test (unpaired, two-tailed). Source data are provided as a Source Data file. |

Atf7ip cooperates with Setdb1 to target bach2b. a Schematic workflow of H3K9me3 and Setdb1 CUT&Tag-seq from FACS-sorted cmyb+ cells in WT and atf7ip−/− mutants at 72 hpf. b Heatmap of replicate correlations for H3K9me3 CUT&Tag in WT and atf7ip−/− mutants. c Heatmap for differentially enriched H3K9me3 peaks in whole genomes of WT and atf7ip−/− mutants. d Venn diagram displaying overlaps between gene-sets with reduced H3K9me3 and increased RNA-seq levels in atf7ip−/− mutants. e IGV tracks of H3K9me3 CUT&Tag-seq, H3K9me3 ChIP-seq, Setdb1 ChIP-seq and Setdb1 CUT&Tag-seq at bach2b locus in WT, atf7ip−/− and setdb1b−/− mutants. f CUT&Tag-qPCR of H3K9me3 levels at bach2b in WT, atf7ip−/−, setdb1b mRNA-injected atf7ip−/− mutants, n = 3. g qPCR of bach2b in WT, atf7ip−/− and setdb1b mRNA-injected atf7ip−/− mutant at 96 hpf, n = 3. h qPCR of bach2b in coro1a-lyz-, coro1a+lyz- and coro1a+lyz+ cells at 96 hpf, n = 3. i JASPAR database displaying BACH2 binding site (Maf element) in ccr9a and irf4a promoters. j CUT&Tag and luciferase reporter assay schematic with primers for ccr9a and irf4a promoters. k Immunoblot of Myc in bach2b-myc mRNA-injected embryos, n = 3. l qPCR of DNA fragments obtained from CUT&Tag assay with primers (F1, R1 or F2, R2), n = 3. m Luciferase activity in HEK293T cells after co-transfection of pGL3-ccr9a-Fluc, Bach2b, and pGL3-ccr9a-Mutant1 (M1), or pGL3-irf4a-Fluc, Bach2b, and pGL3-irf4a-Mutant2 (M2), n = 3. n qPCR of irf4a, ccr9a, cmyb, tcrβ2 in whole embryos of EGFP or bach2b-EGFP mRNA-injected WT (EGFP or Bach2b-EGFP) at 72 hpf, n = 3. o qPCR of ccr9a and irf4a in whole embryos of WT, atf7ip−/− and atf7ip−/− mutants injected with bach2b MO (8 ng per embryo) at 72 hpf, n = 3. p, q WISH displaying cmyb and rag1 expression in thymus (white circles) of WT, atf7ip−/− and bach2b MO-injected atf7ip−/− mutants at 96 hpf. Red, dark gray and light gray squares indicate normal (cmyb/rag1: 45-90), small (cmyb/rag1: 10-45), absence (cmyb/rag1: 0-10) foci. Quantifications are shown in (q), 3 independent experiments. r Number of coro1a:EGFP+/lyz:DsRed- cells entering thymus every 30 min in WT, atf7ip−/−, bach2b MO-injected atf7ip−/− embryos, n = 3. s, t Confocal imaging showing thymic lymphoid progenitors (white circles) of WT, atf7ip−/− and bach2b MO-injected atf7ip−/− embryos on Tg(coro1a:EGFP/lyz:DsRed) background at 72 hpf. Quantification is shown in (t), n = 3. Scale bar, 100 μm (p, s). Quantifications (f–h, l–o, q, r, t) are represented as mean ± SD; ns, P > 0.05, *P < 0.05, **P < 0.01, ***P < 0.001, ****P < 0.0001. Student’s t test (unpaired, two-tailed). Source data are provided as a Source Data file. |

ATF7IP is required for hematopoietic progenitor homing and differentiation in mice.a Schematic diagram of experimental design for poly I:C injection and FACS analysis of Atf7ip Mx1-iCre and Atf7ipf/f mouse. b Immunoblot and quantification depicting the protein level of ATF7IP in the bone marrow of Atf7ip Mx1-iCre and Atf7ipf/f mice, n = 3. c Representative FACS of ETPs (lineage-CD25-CD44+cKit+) in thymus of Atf7ip Mx1-iCre and Atf7ipf/f mice. d Cell number and proportion of ETP population in thymus of Atf7ip Mx1-iCre and Atf7ipf/f mice, n = 3. e, f Total cell number and proportion of double negative thymocyte subsets (DN1, DN2, DN3, and DN4) in Atf7ip Mx1-iCre and Atf7ipf/f mice, n = 3. g, h The cell number and proportion of major thymocyte subsets (DN, double negative, DP, double positive, CD4 SP, CD4 single positive, and CD8 SP, CD8 single positive) among total thymocytes in Atf7ip Mx1-iCre and Atf7ipf/f mice, n = 3. i Schematic diagram depicting transplantation strategy in which CD45.1+ recipient mice received donor-derived CD45.2+Lin- bone marrow cells. j Representative FACS of CD45.2+ donor cells in thymus 48 h after adoptive transfer of Atf7ip Mx1-iCre and Atf7ipf/f mice. k Statistics of CD45.2+Lin- donor cells in thymus of Atf7ip Mx1-iCre and Atf7ipf/f mice after 48 h adoptive transfer, n = 3. l Statistics of CD45.2+Lin- donor cells in the spleen of Atf7ip Mx1-iCre and Atf7ipf/f mice after 48 h adoptive transfer, n = 3. m Representative FACS of CD45.2+ donor cells in thymus 48 h after adoptive transfer of BMCs from Atf7ip CAG-CreERT2 or control Atf7ipf/f mice. n Statistics of CD45.2+Lin- donor cells in thymus of Atf7ip CAG-CreERT2 and control Atf7ipf/f mice after 48 h post transplantation, n = 3. o Statistics of CD45.2+Lin- donor cells in the spleen of Atf7ip CAG-CreERT2 and Atf7ipf/f mice after 48 h post transplantation, n = 3. Quantifications (d–h, k, l, n, o) are represented as mean ± SD; ns, P > 0.05, *P < 0.05, **P < 0.01, ***P < 0.001, ****P < 0.0001. Student’s t test (unpaired, two-tailed). Source data are provided as a Source Data file. |